Amazing technological breakthrough possible @S-Logix
pro@slogix.in
To calculate the descriptive statistics values using pandas groupby function using python.
Read the sample data.
Make it as a data frame.
Use groupby() from pandas library.
#import library
import matplotlib.pyplot as plt
import pandas as pd
#10 sample data
data={‘name’:[‘sathish’,’raj’
,’raja’,’krishna’,’yusuf’,’sathish’
,’raj’,’raja’,’krishna’,’yusuf’],
‘band’:[‘a’,’a’,’a’,’a’,’a’,’b’
,’b’,’b’,’b’,’b’],’age’:
[25,26,25,23,30,29,23,23,25,25],
‘rating’:[4,3.24,2.5,2.25,2,
2.25,2.5,2.75,3.2,4.2],
‘bonus’:[2500,1200,900,1400,
1800,1400,850,250,750, 1000]}
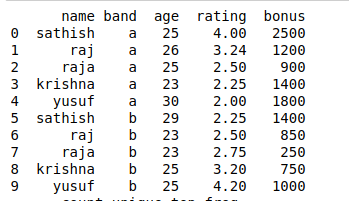
df=pd.DataFrame(data)
print(df)
#Group by function
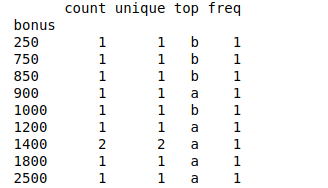
a=df[‘band’].groupby
(df[‘bonus’]).describe()
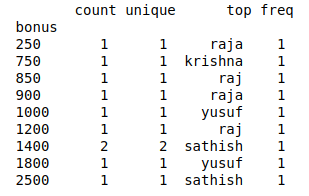
b=df[‘name’].groupby
(df[‘bonus’]).describe()
print(a,”\n”,b)


