#import needed library
import matplotlib.pyplot as plt
import pandas as pd
import numpy as np
#import linear model and train_test_split
from sklearn.model_selection import train_test_split
from sklearn.linear_model import LogisticRegression
from sklearn import metrics
#Read the data file
data=pd.read_csv(‘/home/soft23/soft23/Akshaya/winequality-red.csv’)
def res_mv(df):
for i in df.describe().columns:
if df[i].isnull().sum()!=0:
df[i].fillna(df[i].median(),inplace=True)
for i in df.describe(include=pd.core.series.Series).columns:
if df[i].isnull().sum()!=0:
df[i].fillna(method=”bfill”,inplace=True)
#Function to detect and resolve the outliers
def outlier_detect(df):
for i in df.describe().columns[1:11]:
Q1=df.describe().at[‘25%’,i]
Q3=df.describe().at[‘75%’,i]
IQR=Q3 – Q1
LTV=Q1 – 1.5 * IQR
UTV=Q3 + 1.5 * IQR
x=np.array(df[i])
p=[]
outl=[]
new_data=[]
for k in x:
if kUTV:
outl.append(k)
for e in x:
if e in (outl):
new_data.append(0)
else :
new_data.append(e)
x_temp=np.array(new_data)
median_new=np.median(x_temp)
for j in x:
if j UTV :
p.append(median_new)
else:
p.append(j)
p=pd.DataFrame(p)
df[i]=p
#print(“Outliers resolved”)
return df
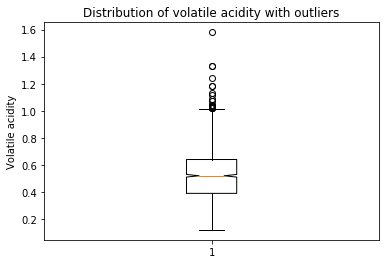
plt.boxplot(data[‘volatile acidity’],notch=True)
plt.title(‘Distribution of volatile acidity with outliers’)
plt.ylabel(‘Volatile acidity’)
plt.show()
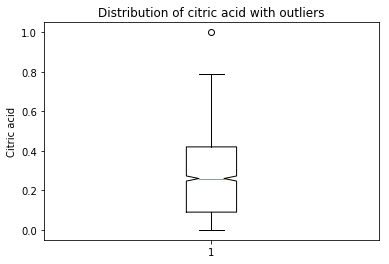
plt.boxplot(data[‘citric acid’],notch=True)
plt.title(‘Distribution of citric acid with outliers’)
plt.ylabel(‘Citric acid’)
plt.show()
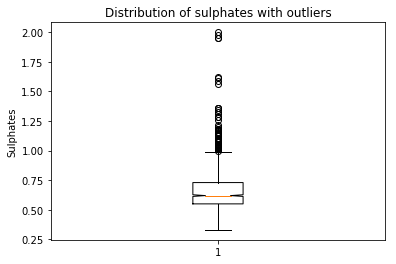
plt.boxplot(data[‘sulphates’],notch=True)
plt.title(‘Distribution of sulphates’)
plt.ylabel(‘Sulphates’)
plt.show()
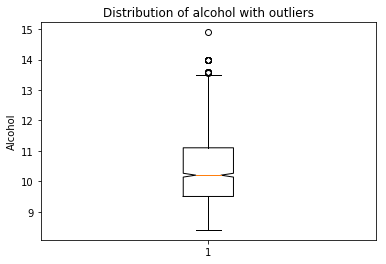
plt.boxplot(data[‘alcohol’],notch=True)
plt.title(‘Distribution of alcohol with outliers’)
plt.ylabel(‘Alcohol’)
plt.show()
for i in range(1,5):
data=outlier_detect(data)
plt.boxplot(data[‘volatile acidity’],notch=True)
plt.title(‘Distribution of volatile acidity without outliers’)
plt.ylabel(‘Volatile acidity’)
plt.show()
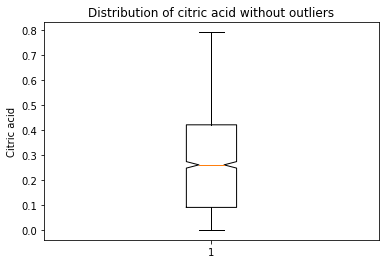
plt.boxplot(data[‘citric acid’],notch=True)
plt.title(‘Distribution of citric acid without outliers’)
plt.ylabel(‘Citric acid’)
plt.show()
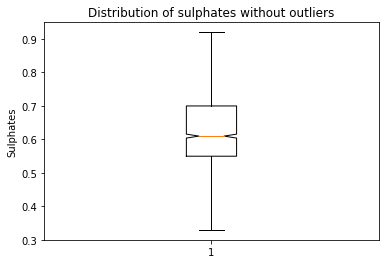
plt.boxplot(data[‘sulphates’],notch=True)
plt.title(‘Distribution of sulphates without outliers’)
plt.ylabel(‘Sulphates’)
plt.show()
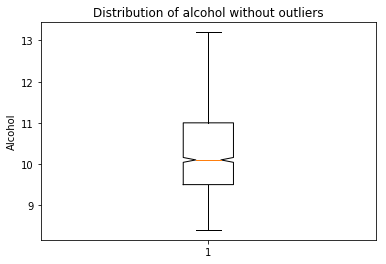
plt.boxplot(data[‘alcohol’],notch=True)
plt.title(‘Distribution of alcohol without outliers’)
plt.ylabel(‘Alcohol’)
plt.show()
x=data[[‘volatile acidity’,’citric acid’,’sulphates’,’alcohol’]].values.reshape(-1,4)
y=data[‘quality’].values.reshape(-1,1)
x_train, x_test, y_train, y_test = train_test_split(x, y, test_size=0.20, random_state=42)
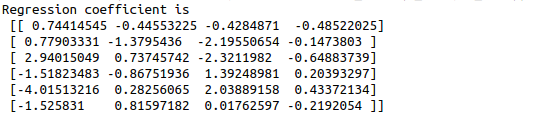
reg = LogisticRegression()
reg.fit(x_train,y_train)
y_pred=reg.predict(x_test)
print(“Regression coefficient is “,reg.coef_)
#classification report
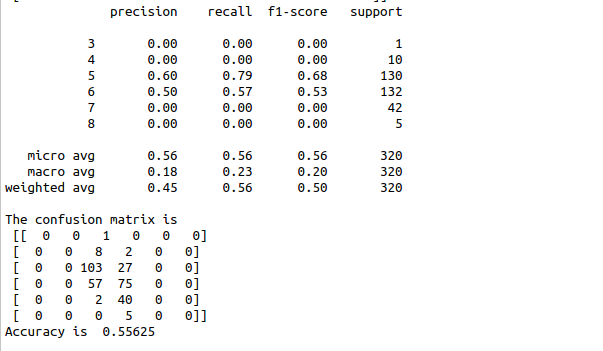
print(metrics.classification_report(y_test,y_pred))
Conf_Mat = metrics.confusion_matrix(y_test, y_pred)
print(“The confusion matrix is\n”,Conf_Mat)
print(“Accuracy is “,metrics.accuracy_score(y_test, y_pred))