To create a scatter plot for the given data in R programming.
Each point represents the values of two variables.
One variable is chosen in the horizontal axis and another in the vertical axis.
R Function :plot()
#Data Visualization in Scatter Plot
#Scatter Plots
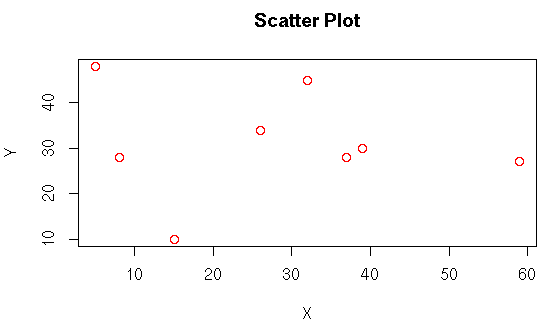
vect<-c(5,8,15,37,39,32,26,59)
vect_1<-c(48,28,10,28,30,45,34,27)
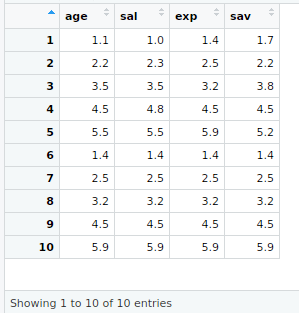
age<-c(1.1,2.2,3.5,4.5,5.5,1.4,2.5,3.2,4.5,5.9)
sal<-c(1.0,2.3,3.5,4.8,5.5,1.4,2.5,3.2,4.5,5.9)
exp<-c(1.4,2.5,3.2,4.5,5.9,1.4,2.5,3.2,4.5,5.9)
sav<-c(1.7,2.2,3.8,4.5,5.2,1.4,2.5,3.2,4.5,5.9)
data_1<-data.frame(age,sal,exp,sav)
View(data_1)
# Plotting Bivariate
plot(vect,vect_1,main=”Scatter Plot”,xlab=”X”,ylab=”Y”,col=”red”)
#Plotting Multivariate
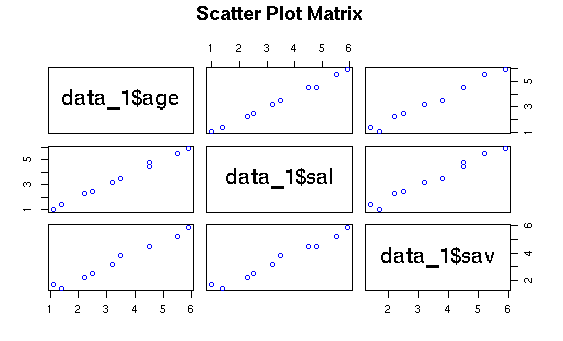
pairs(~data_1$age+data_1$sal+data_1$age+data_1$sav,main=”Scatter Plot Matrix”,col=”blue”)


