To generate the frequency tables using R programming.
To generate frequency tables
R Function :table()
To print the results more attractively.
R Function :ftable()
To generate marginal frequencies
R Function :table()
To generate tables of proportions
R Function :table()
R Package :gmodels
To produce crosstabulations model
R Function :CrossTable()
#Frequency and Contingency Tables
#Input
attach(mtcars)
x<-mtcars$mpg
y<-mtcars$hp
#Table Function
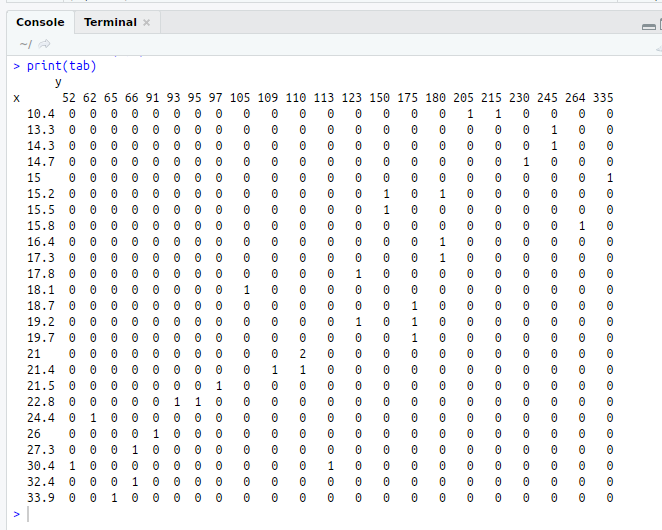
tab<-table(x,y)
print(tab)
#ftable
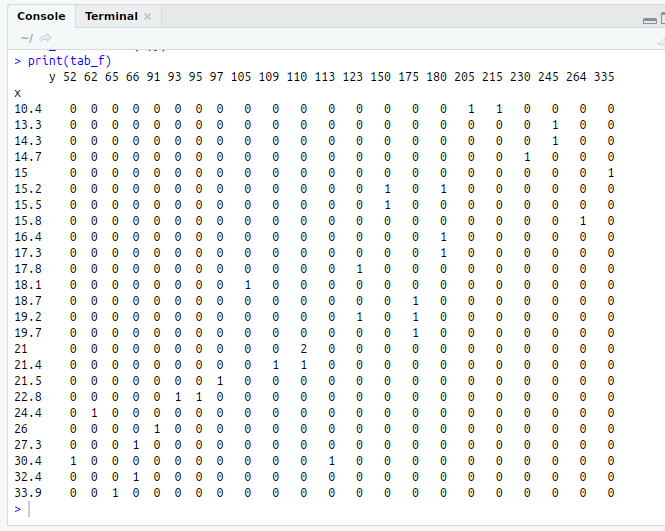
tab_f<-ftable(x,y)
print(tab_f)
#Marginal Frequencies
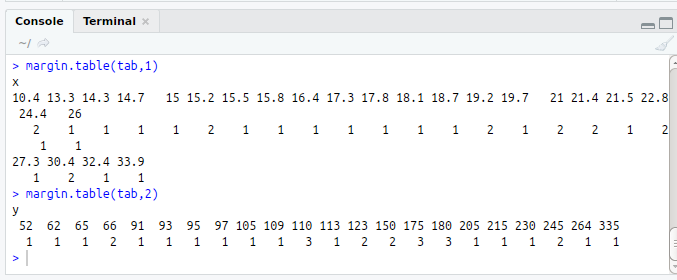
margin.table(tab,1)
margin.table(tab,2)
#table of Proportion
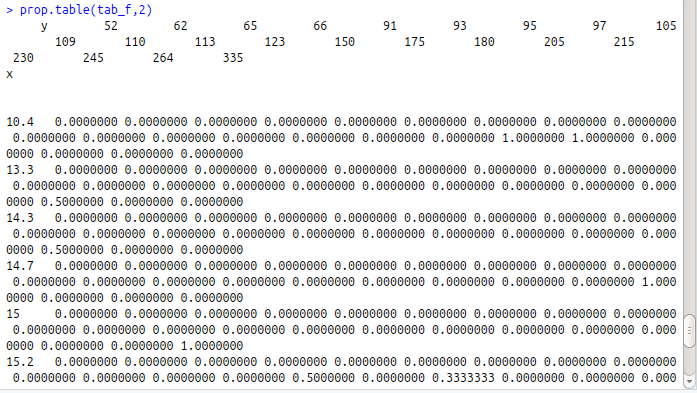
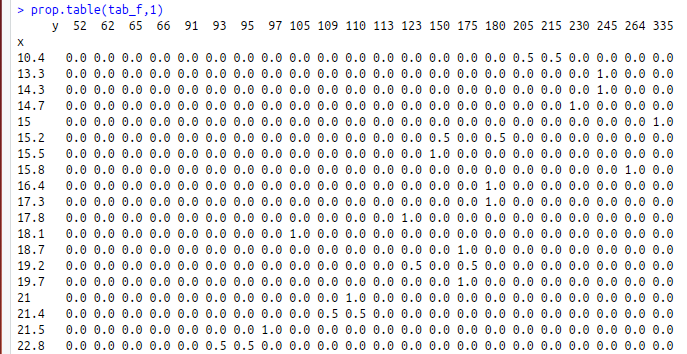
prop.table(tab_f,1)
prop.table(tab_f,2)
#Cross table Function
library(“gmodels”)
#Simple Input
x1<-c(2,4,2,6,2)
x2<-c(2,4,3,6,3)
CrossTable(x1,x2)
