Amazing technological breakthrough possible @S-Logix
pro@slogix.in
To implement the area chart using ggplot2 in R programming.
R Package : ggplot2
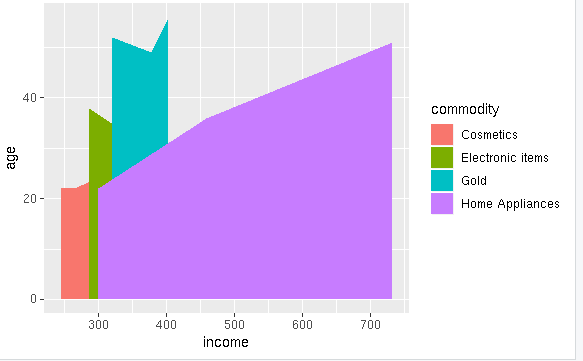
R Function :ggplot(x, aes(x= , y= ), fill= )
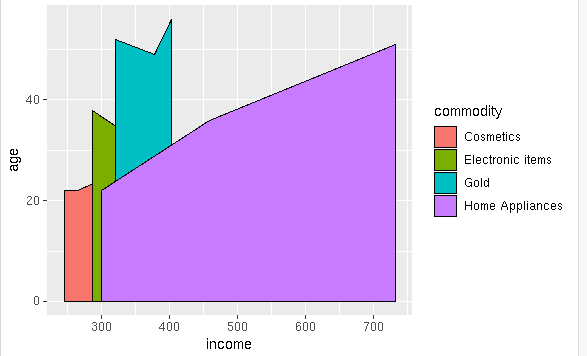
R Function : geom_area(colour =)
x - Data Set
aes- Aesthetic mappings describe
how variables in the data are mapped to visual properties (aesthetics) of geoms.
Aesthetic mappings can be set in ggplot2() and in individual layers.
#Area Chart Using ggplot2
#Loading required Packages
#install.packages(“ggplot2”)
library(“ggplot2”)
#Input
#install.packages(“xlsx”)
library(“xlsx”)
input<-read.xlsx(“OnlineShopping.xlsx”,sheetIndex = 1)
print(head(input))
#Area Chart
ggplot(input,aes(x=income,y=age,fill=commodity)) + geom_area()
ggplot(input,aes(x=income,y=age,fill=commodity)) + geom_area(colour=”Black”)


