Amazing technological breakthrough possible @S-Logix pro@slogix.in

Office Address

  • #5, First Floor, 4th Street Dr. Subbarayan Nagar Kodambakkam, Chennai-600 024 Landmark : Samiyar Madam
  • pro@slogix.in
  • +91- 81240 01111

Social List

How to implement Control Charts in R?

Description

To know about the data types in R programming.

Process
Need for Control Charts?
  • Control charts, also known as Shewhart charts or process- behavior charts, are a statistical process control tool used to determine if a manufacturing or business process is in a state of control.
Interpretation of Control Charts: If it is in Control:
  • If all the points lie within the control limits, the process is said to be “in control”
  • If analysis of the control chart indicates that the process is currently under control, then no corrections or changes to process control parameters are needed.
  • Moreover, data from the method can be used to predict the future performance of the process.
If it is not in Control:
  • If the control chart indicates that the process is not in control, analysis of the chart can help determine the sources of variation, as this willresult in degradation of process performance.
  Need of detecting Outliers:
  • Missing data are a common occurrence and can have a significanteffect on the conclusions that can be drawn from the data.
  Package and Function:
  • R Package : qcc
  • R Function : groups(x) -- For Grouping the data
  • R Function : qcc(x, type=, nsigmas= ,newdata= )
  • x --training data
  • type = “R”,” xbar” -- Type of Control Chart
  • nsigmas -- Default value is 3, means ±3 standard deviation
  • Newdata -- new sample data from the same process
Sapmle Code

#Control Charts
#Loading required packages
#install.packages(“qcc”)
library(“qcc”)
data(pistonrings)
attach(pistonrings)
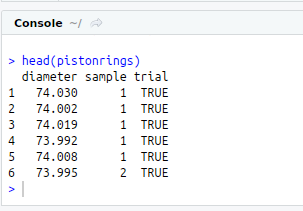
head(pistonrings)

#Grouping the data
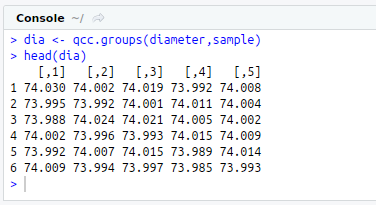
dia<-qcc.groups(diameter,sample)
head(dia)

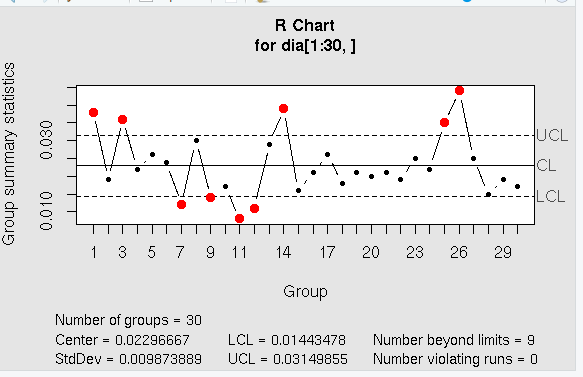
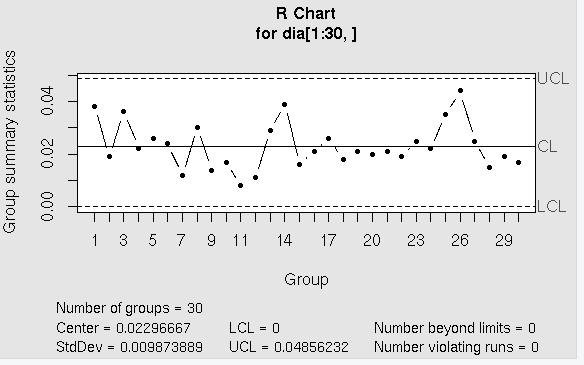
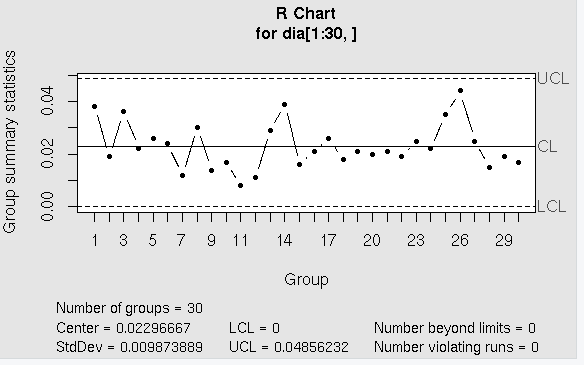
#R Chart
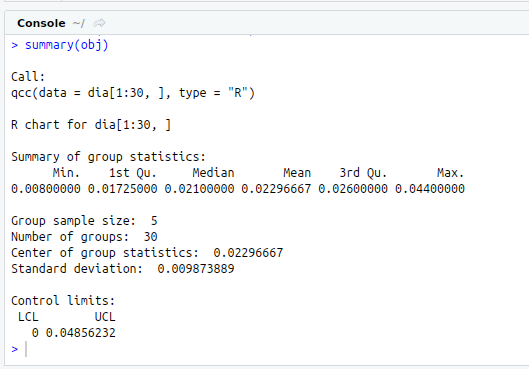
obj<-qcc(dia[1:30,],type = “R”)
summary(obj)

#X- Bar Chart
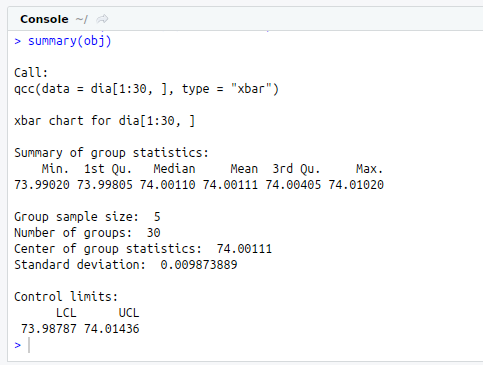
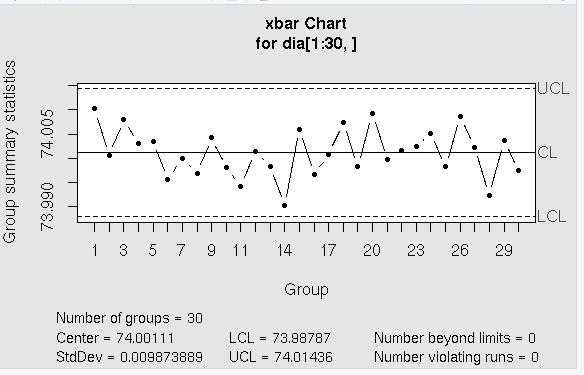
obj<-qcc(dia[1:30,], type=”xbar”)
summary(obj)

#Changing the Values of nsigma
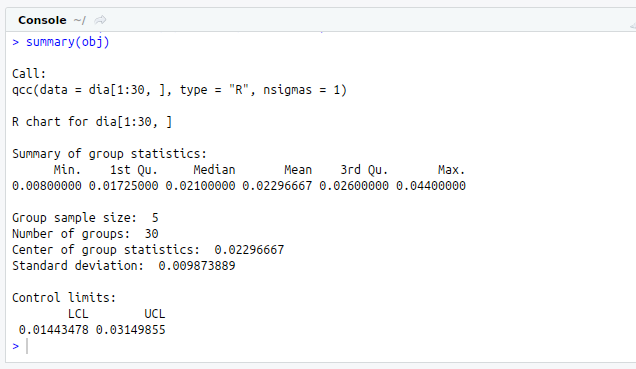
obj<-qcc(dia[1:30,],type=”R”,nsigmas = 1)
summary(obj)

#Testing new Data
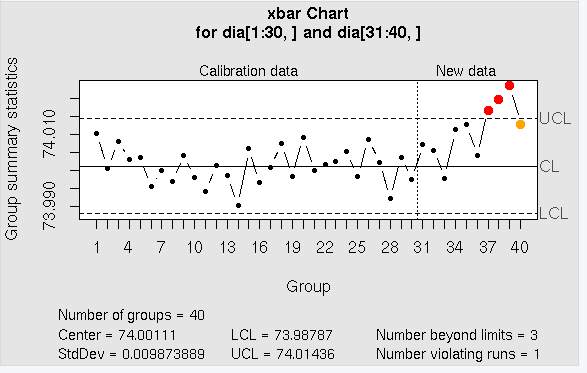
obj<-qcc(dia[1:30,],type = “xbar”,newdata = dia[31:40,])
Screenshots
implement Control Charts in R
Loading required packages
Need for Control Charts
Insatall packages and library
Control charts, also known as  Shewhart charts or process
If it is not in Control
degradation of process  performance
Missing data are a common occurrence  and can have a significanteffect  on the conclusions that can  be drawn from the data
R Function : groups(x)
Predit the future performance