#Normality Test in R
#install caret package
#install.packages(“caret”)
library(“caret”)
#Get and Set Working Directory
print(getwd())
setwd(“/home/soft13”)
getwd()
#Read file from Excel
#install.packages(“xlsx”)
library(“xlsx”)
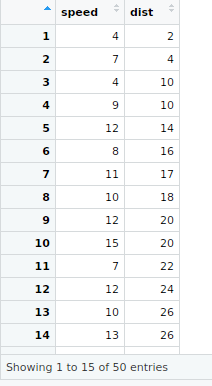
data<-read.xlsx(“ExcelInput.xlsx”,sheetIndex=1)
print(data)
View(data)
#Check Normality
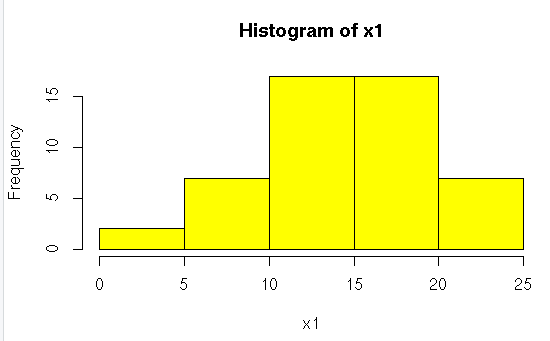
#Histogram Test for Normality
x1<-data$speed
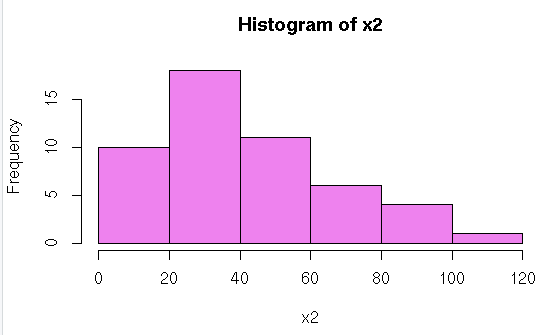
x2<-data$dist
hist(x1,col=”yellow”)
hist(x2,col=”violet”)
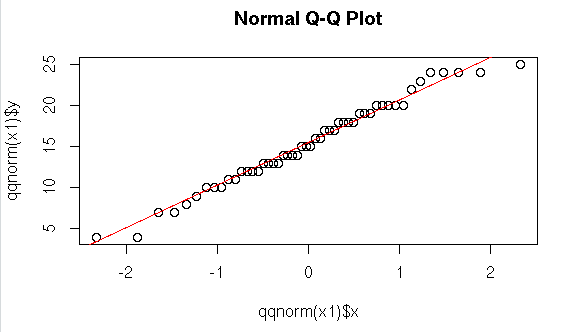
#Q-Q plot
plot(qqnorm(x1))
#Generating a line for Q-Q plot
qqline (x1, col=2)
title(main=”Normal Q-Q Plot”)
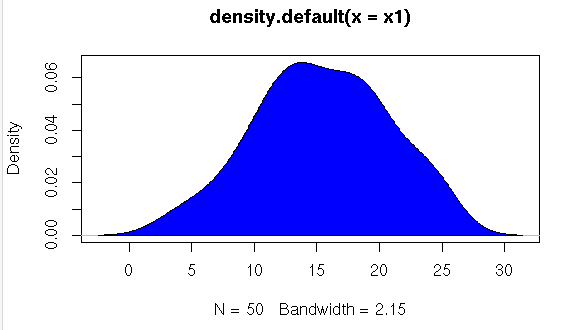
#Density plot
plot(density(x1))
polygon(density(x1),col=”blue”)
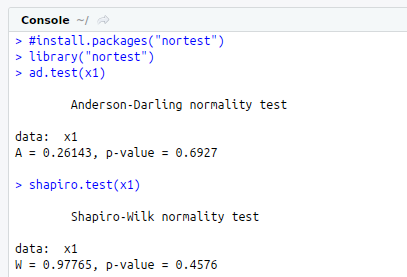
#Anderson – Darling test for Normality
#install.packages(“nortest”)
library(“nortest”)
ad.test(x1)
#Shapiro-Wilk test for Normality
shapiro.test(x1)