library(“caret”)
setwd(“/home/soft23/soft23/Akshaya/R programs”)
data=read.csv(‘/home/soft23/soft23/Akshaya/weight-height.csv’)
data=data.frame(Height=data$Height,Weight=data$Weight)
mis_val<-function(iofile)
{
n=sum(is.na(data))
if(n!=0)
{
tempData completedData data=data.frame(completedData)
return(data)
}else
{
return(iofile)
}
}
#Find and resolve missing values
data=mis_val(data)
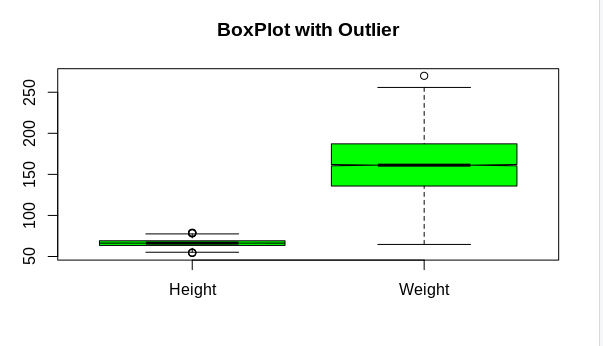
#Data set with outliers
boxplot(data,notch=TRUE,col=”green”,main=”BoxPlot with Outlier”)
#Function to find the outliers
detect_outliers<-function(iofile)
{
col=ncol(iofile)
i=0
for (i in (1:col))
{
sort_d=sort(iofile[,i])
n=length(iofile[,i])
#print(sort_d)
if(n%%2==0)
{
low_half=sort_d[1:(n/2)-1]
upp_half=sort_d[((n/2)+2):n]
median=(sort_d[n/2]+sort_d[(n/2)+1])/2
}else
{
low_half=sort_d[1:(n/2)]
upp_half=sort_d[((n/2)+2):(n+1)]
median=sort_d[(n/2)+1]
}
#print(low_half)
#print(upp_half)
#print(median)
q1=median(low_half)
q3=median(upp_half)
iqr=q3-q1
#print(q1)
#print(q3)
#print(iqr)
otl=c()
j=0
a=0
for(a in (1:n))
{
#cat(“FOR LOOP I “,i)
if((sort_d[a]<q1-(1.5*iqr))|(sort_d[a]>q3+(1.5*iqr)))
{
j=j+1
otl[j]=sort_d[a]
#print(otl)
}
}
#cat(“\nNo.of outliers present in the data “,j)
#cat(“\nThe outliers are “,otl)
new_d=sort_d
for(l in 1:j)
{
new_d=new_d[new_d!=otl[l]]
}
#print(new_d)
mean1=mean(new_d)
median1=median(new_d)
for(k in (1:n))
{
for(l in (1:j))
{
if((iofile[,i][k]%in%otl[l]))
{
iofile[,i][k]=mean1
}
}
}
#cat(“\nData after resolving outliers \n”,data$SALARY)
}
return(iofile)
}
data=detect_outliers(data)
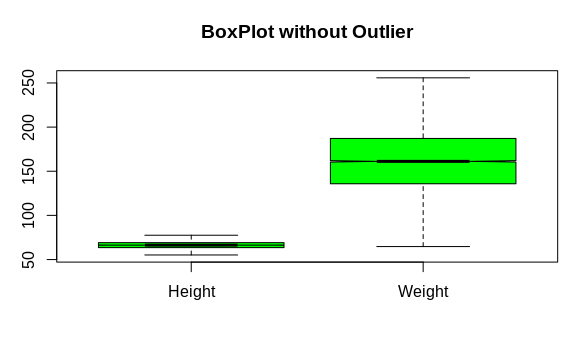
#data set after resolving outliers
boxplot(data,notch=TRUE,col=”green”,main=”BoxPlot without Outlier”)
#Setting seed to reproduce results of random sampling data
set.seed(100)
#Train set
train_ind<-createDataPartition(data$Weight,p=0.8,list=FALSE)
train_data<-data[train_ind,]
xtrain=train_data[,2]
ytrain=train_data$Weight
#Test Data
test=data[-train_ind,]
xtest=data.frame(Height=test$Height)
ytest=test$Weight
#Train the model
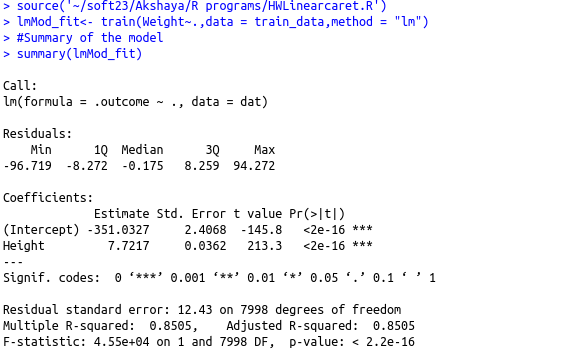
lmMod_fit #Summary of the model
summary(lmMod_fit)
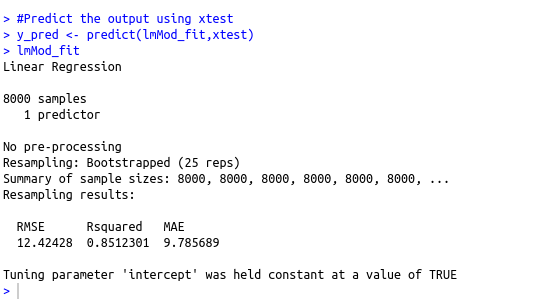
#Predict the output using xtest
y_pred lmMod_fit