#Hierarchical clustering Sample
#Loading required packages
library(“cluster”) #Clustering algorithms
library(“factoextra”) #Clustering Visualization
library(“stats”) #for hclust function
library(“NbClust”) #Clustering and Visualization
#Input
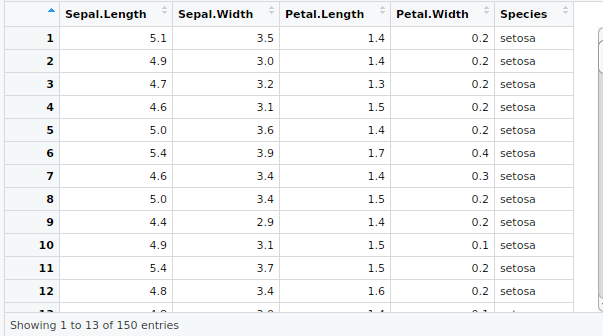
input<-iris
View(input)
#Data Preparation
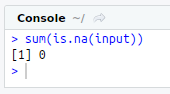
#Missing values
sum(is.na(input))
#Dissimilarity matrix
hier_dist<-dist(input,method = “euclidean”)
#Agglomerative(AGNES) clustering
#hclust function
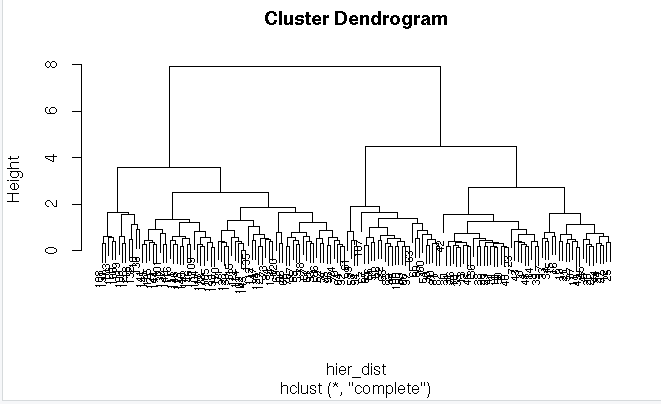
hier<-hclust(hier_dist,method = “complete”)
plot(hier,cex=0.6)
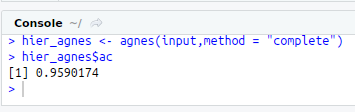
#agnes function using method complete
hier_agnes<-agnes(input,method = “complete”)
hier_agnes$ac
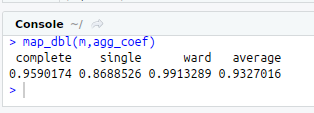
#Finding the more appropriate method for more strongest clustering structure
#install.packages(“purrr”)
library(“purrr”)
m<-c(“complete”,”single”,”ward”,”average”)
names(m)<-c(“complete”,”single”,”ward”,”average”)
agg_coef<-function(x){
agnes(input,method = x)$ac
}
map_dbl(m,agg_coef)
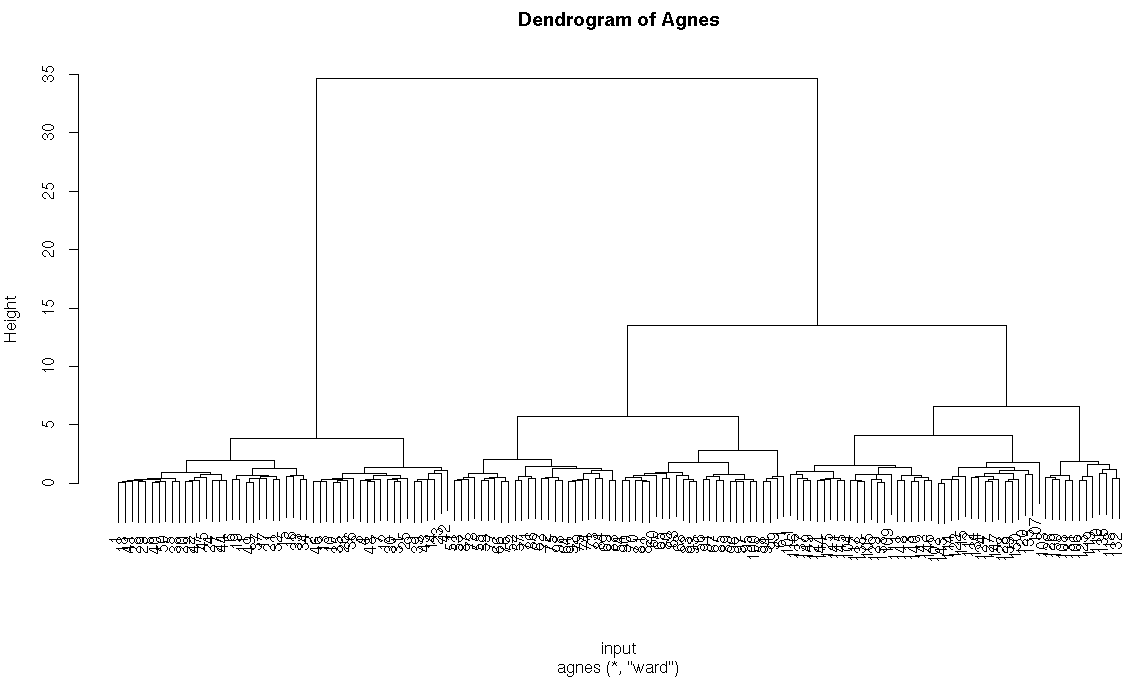
#agnes function using ward method
h_agnes<-agnes(input,method = “ward”)
pltree(h_agnes,main=”Dendrogram of Agnes”)
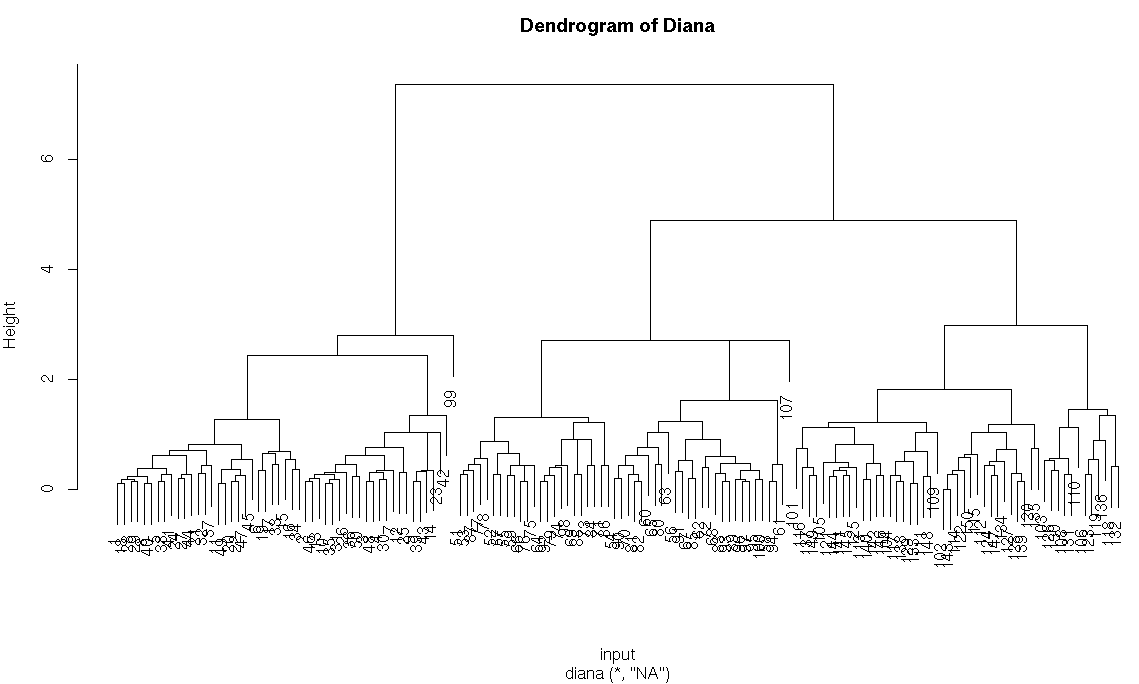
#diana method
h_diana<-diana(input)
h_diana$dc
pltree(h_diana,main = “Dendrogram of Diana”)
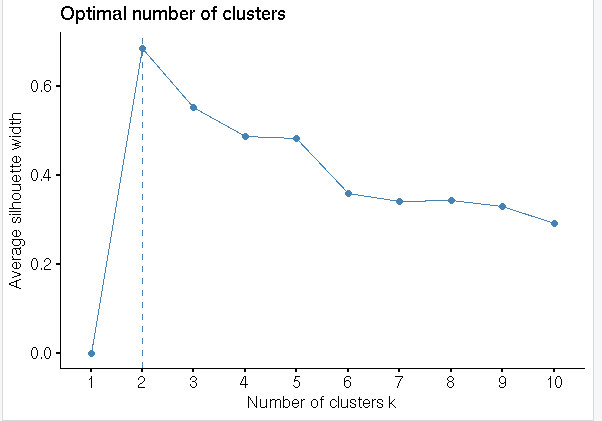
#Optimal number of cluster
fviz_nbclust(input,FUN = hcut, method = “silhouette”)
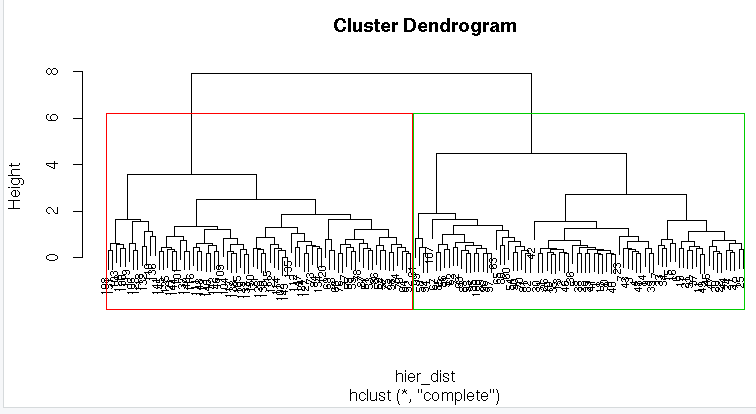
#Dendrogram with border around two clusters
hier<-hclust(hier_dist,method = “complete”)
plot(hier,cex=0.6)
rect.hclust(hier,k=2,border = 2:6)