How to plot the correlation matrix using matplot library in python?
Description
To plot the correlation matrix for a given data set using python.
Process
Import pandas library.
Load the sample data set.
We can pass the numbers(like df.head(8))also in that function.
Store the data set in to pandas.
Sample Code
#import pandas library
import pandas as pd
#read data set from csv file
data=pd.read_csv(‘/home/soft27/soft27
/Sathish/Pythonfiles/Employee.csv’)
df=pd.DataFrame(data)
print(df)
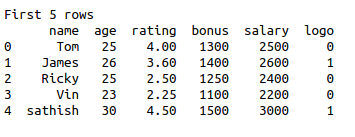
#head method,by default its print first 5 rows in a data set.
print(“\n”)
print(“First 5 rows”)
print(df.head())
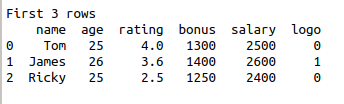
#to print rows by passing arguments.
print(“\n”)
print(“First 3 rows”)
print(df.head(3))
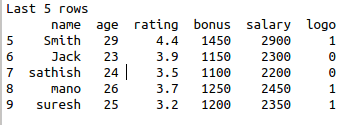
#tail method,by default its print last 5 rows in a data set
print(“\n”)
print(“Last 5 rows”)
print(df.tail())
#to print rows by passing arguments.
print(“\n”)
print(“Last 6 rows”)
print(df.tail(6))
Screenshots


- PhD Guidance and Support Enquiry
- Masters and PhD Project Enquiry
- IoT Contiki Source Code
- Cloud Computing Source Code
- R Programming Source Code
- Machine Learning Research Topics
- Data Mining Research Topics
- Big Data Research Topics
- Artificial Intelligence Research Topics
- Cybersecurity Research Topics
- Machine Learning Projects
- Data Mining Projects
- Big Data Projects