Amazing technological breakthrough possible @S-Logix
pro@slogix.in
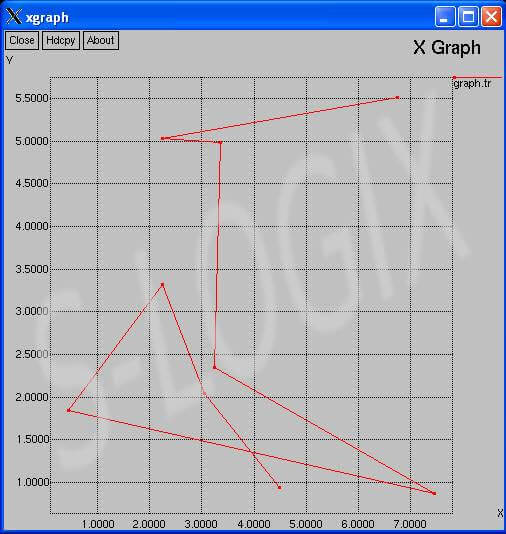
Sample graph generation done using TCL script. Graph points are randomly generated and plotted using xgraph.
#Graph procedure..
$ns at 1.0 "Graph"
set g [open graph.tr w]
proc Graph {} {
global ns g
set time 1.0
set now [$ns now]
puts $g "[expr rand()*8] [expr rand()*6]"
$ns at [expr $now+$time] "Graph"
}
exec xgraph -M -bb -geometry 500X500 graph.tr &
#################################################################
Graph Generation Format:
exec xgraph -bg white -t PACKET_DELIVERY_RATIOvsTIME -x TIME -y PDR(%) pdr.tr &
-bg white : Background color of graph is white
-t : Title of the graph = PACKET_DELIVERY_RATIOvsTIME
-x : Name of the x coordinate = TIME
-y : Name of the y coordinate = PDR (%)
pdr.tr : File contains the x, y points to plot the graph
