Research Breakthrough Possible @S-Logix pro@slogix.in

Office Address

Social List

How to Build a Logistic Regression Model for Classification Tasks Using Python?

Logistic Regression Model for Train Data Set using Python

Condition for Logistic Regression Model on Train DataSet in Python

  • Description:
    Logistic Regression is a widely used algorithm in statistics and machine learning for binary classification tasks, i.e., predicting one of two possible outcomes. It is a statistical method for analyzing datasets in which the outcome variable is categorical, typically binary.In this document, we will demonstrate how to implement a logistic regression model using Python,perform exploratory data analysis (EDA), visualize data, evaluate model performance, and interpret the results.
  • three major concepts in logistic rgression:
    prediction :
    Y pred = 1/1+e**-(mx+c)
    cost (or) loss function :
    cost=1/n summation (y.log(p)+(1-y).log(1-p))
    gradient descent :
    cost=1/n summation (y.log(p)+(1-y).log(1-p))
    alpha = 0.01 default value (learning rate)
    m = m-alpha (rho(j)/rho(m))
    c = c-alpha (rho(j)/rho(c))
    rho(j)/rho(c) = -1/n summation (Y pred-Y)
    rho(j)/rho(m) = -1/n summation (Y pred-Y).Xi
Why Should We use Logistic Regression?
  • Simplicity & Interpretability: Logistic regression is easy to implement, and its results are easy to interpret. It provides the probability that an instance belongs to a particular class.
  • Efficiency: Logistic regression works well with smaller datasets, is computationally inexpensive, and performs well when the relationship between the dependent and independent variables is approximately linear.
  • Probabilistic Interpretation: Unlike other classification algorithms, logistic regression provides probability scores, which can be helpful for further decision-making.
  • Foundation for More Complex Models: Logistic regression serves as the foundation for more complex machine learning algorithms like neural networks.
Step-by-Step Process
  • Data Selection & Preprocessing:
    Load and clean the dataset.
    Handle missing data.
    Convert categorical variables into numeric features.
    Split data into training and test sets.
  • Model Building & Training:
    Instantiate a logistic regression model.
    Fit the model to the training data.
  • Model Evaluation & Metrics:
    Visualize the dataset using graphs such as heatmaps and plots for deeper insights.
  • Conclusion:
    Interpret the results.
    Discuss the pros and cons of logistic regression for the given problem.
Sample Code
  • import pandas as pd # Used to load and read the dataset
    from sklearn.preprocessing import LabelEncoder # Convert categorical data to
    integers
    from sklearn.preprocessing import StandardScaler # Standardize data to a normal
    distribution
    import matplotlib.pyplot as plt # Used for visualization
    import seaborn as sns # Used for creating heatmaps
    from sklearn.model_selection import train_test_split # Split data into train and
    test sets
    from sklearn.linear_model import LogisticRegression # Logistic Regression model
    from sklearn.metrics import accuracy_score,classification_report
    # Load the weather dataset
    data =pd.read_csv("Test Data.csv")
    df = pd.DataFrame(data)
    # Drop columns with low correlation to the target variable
    df = df.drop(['row ID', 'Location', 'MinTemp', 'Evaporation', 'WindGustSpeed',
    'WindSpeed9am',
    'Pressure9am', 'WindSpeed3pm', 'Pressure3pm', 'Temp9am',
    'WindGustDir', 'WindDir9am', 'WindDir3pm'], axis=1)
    # Calculate the mean for the relevant columns with missing values
    MaxTemp_mean = df['MaxTemp'].mean()
    Rainfall_mean = df['Rainfall'].mean()
    Sunshine_mean = df['Sunshine'].mean()
    Humidity9am_mean = df['Humidity9am'].mean()
    Humidity3pm_mean = df['Humidity3pm'].mean()
    Cloud9am_mean = df['Cloud9am'].mean()
    Cloud3pm_mean = df['Cloud3pm'].mean()
    Temp3pm_mean = df['Temp3pm'].mean()
    # Fill missing values (NaN) with the respective column means
    df['MaxTemp'].fillna(MaxTemp_mean, inplace=True)
    df['Rainfall'].fillna(Rainfall_mean, inplace=True)
    df['Sunshine'].fillna(Sunshine_mean, inplace=True)
    df['Humidity9am'].fillna(Humidity9am_mean, inplace=True)
    df['Humidity3pm'].fillna(Humidity3pm_mean, inplace=True)
    df['Cloud9am'].fillna(Cloud9am_mean, inplace=True)
    df['Cloud3pm'].fillna(Cloud3pm_mean, inplace=True)
    df['Temp3pm'].fillna(Temp3pm_mean, inplace=True)
    # Convert categorical data in 'RainToday' column to integer values using
    LabelEncoder
    l_encoder = LabelEncoder()
    df['RainToday'] = l_encoder.fit_transform(df['RainToday'])
    # Calculate the correlation matrix to observe relationships between variables
    correlation_matrix = df.corr()
    # Plot the heatmap to visualize the correlations
    plt.figure(figsize=(10, 8))
    sns.heatmap(correlation_matrix, annot=True, cmap='coolwarm', square=True,
    fmt=".2f")
    plt.title("Weather Dataset Correlation Heatmap")
    plt.show()
    # Define features (X) and target variable (y)
    x = df.drop(['RainToday'], axis=1) # Features (all columns except the target
    variable)
    y = df['RainToday'] # Target variable (RainToday)
    # Standardize the features to have a standard normal distribution (zero mean, unit
    variance)
    s_scalar = StandardScaler()
    x = s_scalar.fit_transform(x)
    # Split the data into training and testing sets (90% train, 10% test)
    x_train, x_test, y_train, y_test = train_test_split(x, y, test_size=0.1)
    # Train a logistic regression model on the training data
    model = LogisticRegression()
    model.fit(x_train, y_train)
    # Predict the target variable on the training data
    y_predict = model.predict(x_train)
    # Calculate the accuracy of the model on the training data
    accuracy = accuracy_score(y_train, y_predict)
    print(f"Accuracy Score = {accuracy}")
    classi_report = classification_report(y_train, y_predict)
    print(f"classification_report Score = {classi_report}")
Screenshots
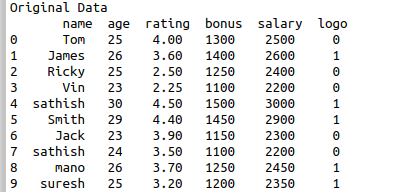
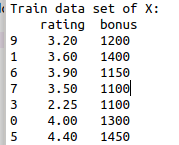
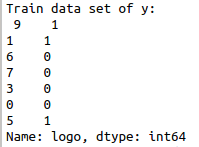
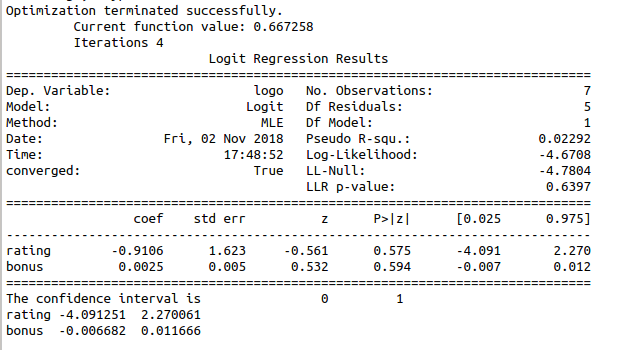
  • Logistic Regression Model1
  • Logistic Regression Model2