Research Breakthrough Possible @S-Logix
Office Address
- 2nd Floor, #7a, High School Road, Secretariat Colony Ambattur, Chennai-600053 (Landmark: SRM School) Tamil Nadu, India
- pro@slogix.in
- +91-81240 01111
To reduce the dimension of a given data set using linear discriminant analysis and build a machine learning model
lda(formula,data) – To compute the Linear discriminant analysis
Human activity recognition using Smart phone
require(MASS)
library(caret)
library(naivebayes)
library(AUC)
Load the required libraries
Load the data set
Split the data frame for train and test
Compute the Linear Discriminant Analysis using the train data
Predict using the test data
Compute the confusion Matrix
Build the naive bayes model using train data
Predict using the test data
Compute the confusion matrix
Compare the confusion matrix obtained from the two model and interpret the result
#load the required libraries
require(MASS)
library(caret)
library(naivebayes)
library(AUC)
#Load the data set
data=read.csv(‘/……/X_train.txt’,header=FALSE,sep=””)
y=read.csv(‘/home/soft23/Downloads/UCI HAR Dataset/train/y_train.txt’,header=FALSE)
#To Split 80% of data as training data
smp_size train_ind train1 test1 #Perform linear discriminant analysis
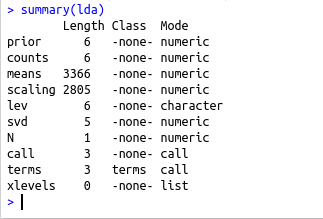
lda #Take the summary
summary(lda)
pred1=predict(lda,test1)
pred=pred1$class
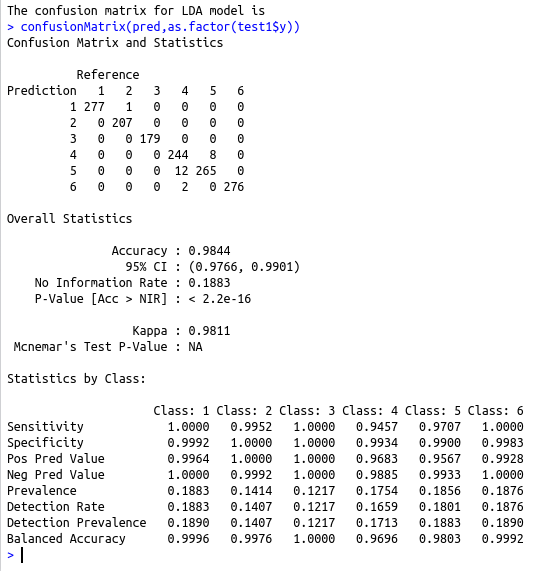
cat(“\nThe confusion matrix for LDA model is \n”)
confusionMatrix(pred,as.factor(test1$y))
#Build the naive bayes model using the original train data
nb1 #Predict using the original test data
pred2=predict(nb1,test1)
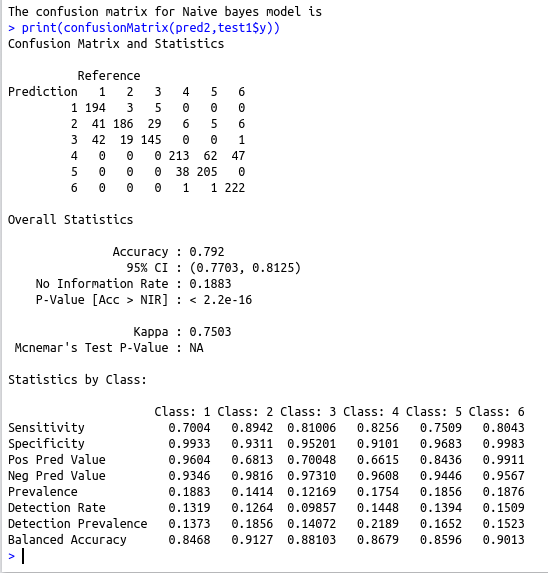
#Compute the confusion matrix
cat(“\nThe confusion matrix for Naive bayes model is \n”)
print(confusionMatrix(pred2,test1$y))
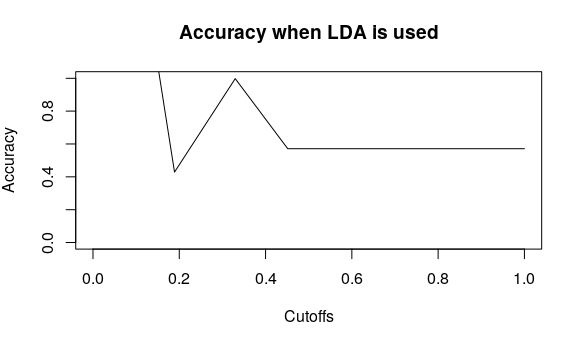
#To interpret the result
plot(accuracy(pred,test1$y), type = “l”,main=”Accuracy when LDA is used”)
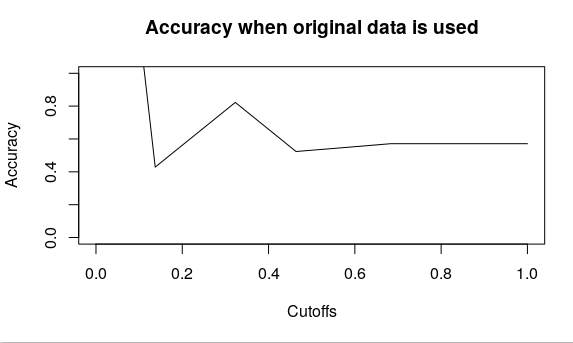
plot(accuracy(pred2,test1$y), type = “l”,main=”Accuracy when original data is used”)
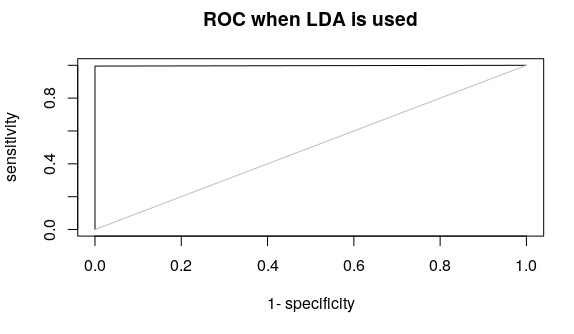
plot(roc(pred,test1$y), type = “l”,main=”ROC when LDA is used”)
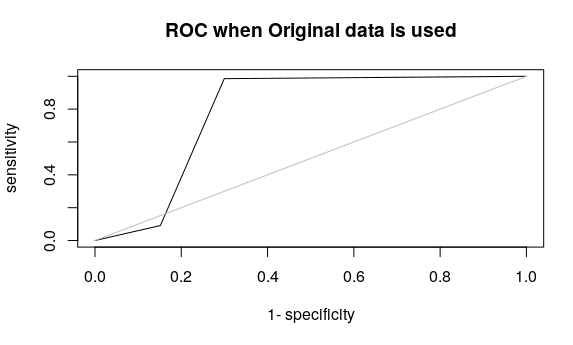
plot(roc(pred2,test1$y), type = “l”,main=”ROC when Original data is used”)