To build Multi layer perceptron using sklearn in python.
Iris Data set.
Confusion matrix
Classification report
Accuracy score
Precision and recall
Load the data set.
Define the independent and dependent variable.
Build the MLP model.
Initiate activation and optimizer functions according to the problem.
Split the data into train and testing set.
Fit the training set into the model.
Predict the test results using MLP.
Calculate the accuracy, precision and recall.
#import libraries
import pandas as pd
import warnings
import random
warnings.filterwarnings(“ignore”)
import seaborn as sns
import matplotlib.pyplot as plt
from sklearn.preprocessing import StandardScaler
from sklearn.model_selection import train_test_split
from sklearn import metrics
from sklearn.neural_network import MLPClassifier
#load the sample data from sample.xlsx file
data = pd.read_csv(‘………..file path………/iris.csv’)
#Make it as a data frame
df = pd.DataFrame(data)
#shape of data
print(“Rows and columns of data\n”,df.shape)
print(“\n”)
#feature selection
X = df.iloc[:,0:4]
y = df.iloc[:,4]
#Scaling the independent variable
sc = StandardScaler()
X = sc.fit_transform(X)
X = sc.transform(X)
#splitting data
X_train, X_test, y_train, y_test = train_test_split(X, y, test_size = 0.1,random_state=0)
#Print training data
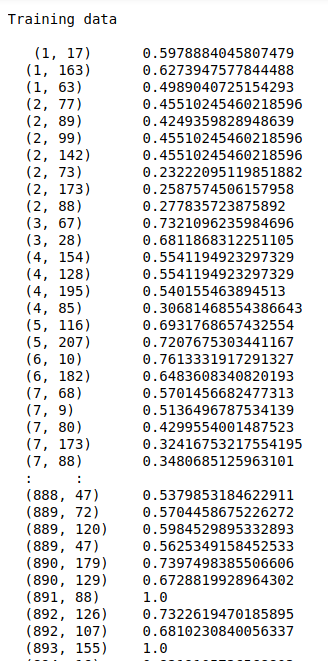
print(“Training data\n”,X_train,”\n”,y_train)
print(“\n\n”)
#Print testing data
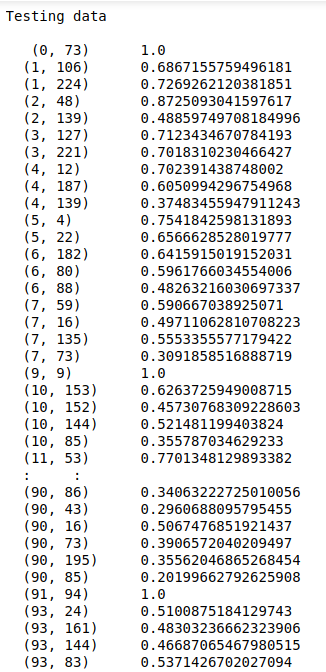
print(“Testing data\n”,X_test)
print(“\n\n”)
#Neural network model
clf=MLPClassifier(activation=’relu’,solver=’adam’, batch_size=50,alpha=1e-5,hidden_layer_sizes=(150,140,130),
random_state=42,learning_rate=’adaptive’)
#fit the model
clf.fit(X_train, y_train)
# Predicting the Test set results
y_pred = clf.predict(X_test)
# Creating the Confusion Matrix
cm = metrics.confusion_matrix(y_test, y_pred)
print(“\n”,”Confusion matrix\n”)
fig, ax = plt.subplots(figsize=(7,5))
sns.heatmap(cm, annot=True, fmt=’d’)
plt.show()
print(“Classification report\n”,metrics.classification_report(y_test, y_pred))
print(“Accuracy of the model : “,metrics.accuracy_score(y_test, y_pred)*100)
#Precision-recall graph
plt.rcParams[“figure.figsize”] = [16,10]
import scikitplot as skplt
probas = clf.predict_proba(X_test)
skplt.metrics.plot_precision_recall(y_test, probas)
plt.title(“Precision & Recall graph”)
plt.show()


