List of Topics:
Research Breakthrough Possible @S-Logix pro@slogix.in

Office Address

Social List

How to Predict Breast Cancer Using a Multi-Layer Perceptron with Scikit-Learn in Python?

Predict Breast Cancer Using Multi Layer Perceptron from Sklearn in Python

Condition for Predicting Breast Cancer Using a Multi-Layer Perceptron with Scikit-Learn in Python

  • Description:
    The given code implements a machine learning model using the Breast Cancer dataset to predict the diagnosis (malignant or benign). It performs data preprocessing, including handling null values, scaling the features, and encoding the target variable. The model is built using a Multi-layer Perceptron (MLP) classifier with a neural network architecture, trained on the dataset to classify the diagnosis.
Step-by-Step Process
  • Step1: The Breast Cancer dataset is loaded using pd.read_csv().
  • Step2: The code checks for any missing values in the dataset using df.isnull().sum().
  • Step3: It calculates the correlation between the features using df.corr() and visualizes it with a heatmap using seaborn.
  • Step4: The distribution of the target variable (diagnosis) is visualized using a bar plot to check for class imbalance.
  • Step5: The target variable (diagnosis) is converted from categorical to numeric values using LabelEncoder().
  • Step6: The features are scaled using StandardScaler() to normalize the data and improve model performance.
  • Step7: The dataset is split into training and testing sets using train_test_split() with 80% training data and 20% testing data.
  • Step8: A Multi-layer Perceptron (MLP) classifier is defined with hidden layers (128, 64, 32) using the MLPClassifier() from sklearn.
  • Step9: The model is trained using the training data with mlp.fit().
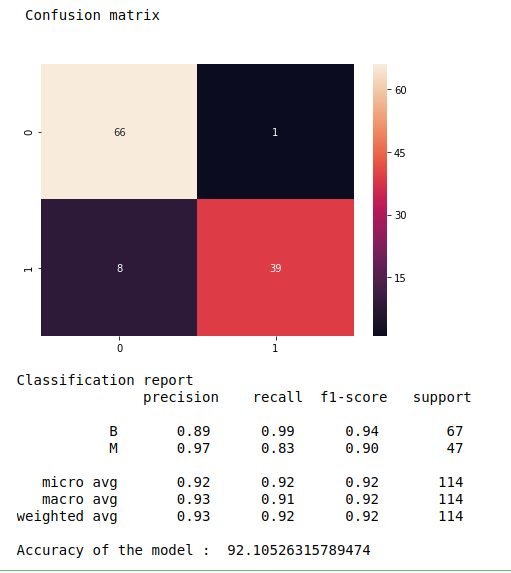
  • Step10: The model is evaluated using the test data, and various performance metrics (accuracy, F1 score, recall, precision) are computed. A confusion matrix is visualized using seaborn.heatmap() to assess the model’s predictions.
Sample Code
  • #Import Necessary Libraries
    import pandas as pd
    import matplotlib.pyplot as plt
    import seaborn as sns
    from sklearn.preprocessing import LabelEncoder, StandardScaler
    from sklearn.neural_network import MLPClassifier
    from sklearn.model_selection import train_test_split
    import warnings
    warnings.filterwarnings("ignore")
    from sklearn.metrics import (classification_report, confusion_matrix, accuracy_score,
    f1_score, recall_score, precision_score)
    df = pd.read_csv("/home/soft12/Downloads/sample_dataset/Website/Dataset/breast-cancer.csv")
    #check null values
    df.isnull().sum()
    #calculate correlation between features
    # Compute the correlation matrix
    correlation_matrix = df.corr()
    # Display the correlation matrix
    print(correlation_matrix)
    # Plot the heatmap
    plt.figure(figsize=(10, 8))
    sns.heatmap(correlation_matrix, annot=True, cmap='coolwarm', fmt='.2f', linewidths=0.5)
    plt.title('Correlation Heatmap')
    plt.show()
    x = df.drop('diagnosis', axis=1)
    y = df['diagnosis']
    # Count the number of samples per class
    class_counts = y.value_counts()
    # Plot the class distribution
    plt.figure(figsize=(8, 6))
    sns.barplot(x=class_counts.index, y=class_counts.values, palette="viridis")
    plt.title('Class Balance Check', fontsize=16)
    plt.xlabel('Class', fontsize=14)
    plt.ylabel('Count', fontsize=14)
    plt.xticks(fontsize=12)
    plt.yticks(fontsize=12)
    plt.grid(axis='y', linestyle='--', alpha=0.7)
    plt.show()
    #converting object to numeric in target column
    label = LabelEncoder()
    y = label.fit_transform(y)
    #Scaling the input data
    scaler = StandardScaler()
    x = scaler.fit_transform(x)
    #Split the train_test_data
    X_train, X_test, y_train, y_test = train_test_split(x, y, test_size=.2, random_state=42)
    # Define the MLP Classifier
    mlp = MLPClassifier(hidden_layer_sizes=(128, 64, 32),
    activation='relu',
    solver='adam',
    max_iter=10,
    batch_size=2,
    random_state=42,
    verbose=True)
    # Train the model
    mlp.fit(X_train, y_train)
    # Make predictions
    y_pred = mlp.predict(X_test)
    print("___Performance_Metrics___\n")
    print('Classification_Report:\n', classification_report(y_test, y_pred))
    print('Confusion_Matrix:\n', confusion_matrix(y_test, y_pred))
    print('Accuracy_Score: ', accuracy_score(y_test, y_pred))
    print('F1_Score: ', f1_score(y_test, y_pred))
    print('Recall_Score: ', recall_score(y_test, y_pred))
    print('Precision_Score: ', precision_score(y_test, y_pred))
    #Plot Confusion Matrix
    # Compute confusion matrix
    cm = confusion_matrix(y_test, y_pred)
    # Plot confusion matrix using seaborn heatmap
    plt.figure(figsize=(6, 6))
    sns.heatmap(cm, annot=True, fmt='d', cmap='Blues', xticklabels=['0', '1'], yticklabels=['0', '1'])
    plt.title('Confusion Matrix')
    plt.xlabel('Predicted Label')
    plt.ylabel('True Label')
    plt.show()
Screenshots
  • Predict Breast Cancer