Research breakthrough possible @S-Logix pro@slogix.in

Office Address

Social List

How to Implement K-Nearest Neighbors (KNN) Algorithm Using Scikit-learn in Python

How to Implement K-Nearest Neighbors (KNN) Algorithm Using Scikit-learn in Python

Condition for K-Nearest Neighbors (KNN) Algorithm Using scikit-learn in Python

  • Description:
    K-Nearest Neighbors (KNN) is a simple and powerful algorithm used for classification and regression tasks. It works by finding the 'K' closest data points to a given input point and assigning a label based on the majority vote of these neighbors (for classification) or averaging their values (for regression). KNN is a non-parametric and lazy learning algorithm, meaning it does not require a training phase and makes decisions at the time of prediction.
  • In this documentation, we will implement a K-Nearest Neighbors Classifier using the scikit-learn library to classify data points.
Step by Step Process
  • Step 1: Data Collection
    Collect or choose a dataset that contains labeled data points for classification.
  • Step 2: Data Preprocessing
    Clean the data, handle missing values, and normalize the features (since KNN is sensitive to the scale of the data).
  • Step 3: Model Training
    KNN does not have a traditional training phase; it memorizes the entire dataset.
  • Step 4: Distance Calculation
    Calculate the distance between the test point and all training points.
  • Step 5: Finding Neighbors
    Sort the distances and select the 'K' nearest points.
  • Step 6: Classification/Regression
    For classification, use majority voting to predict the class label of the test point. For regression, calculate the average of the K-nearest values.
  • Step 7: Model Evaluation
    Evaluate the model using various classification metrics such as accuracy, confusion matrix, precision, recall, and F1-score.
Sample Code
  • # Import necessary libraries
    import numpy as np
    import pandas as pd
    import seaborn as sns
    import matplotlib.pyplot as plt
    from sklearn.model_selection import train_test_split
    from sklearn.preprocessing import StandardScaler
    from sklearn.neighbors import KNeighborsClassifier
    from sklearn.metrics import classification_report, confusion_matrix, accuracy_score
    from sklearn.datasets import load_iris

    # 1. Load dataset
    data = load_iris()
    X = data.data
    y = data.target

    # 2. Data Preprocessing
    # Split the dataset into training and testing sets
    X_train, X_test, y_train, y_test = train_test_split(X, y, test_size=0.3, random_state=42)

    # Standardize the features (important for KNN)
    scaler = StandardScaler()
    X_train = scaler.fit_transform(X_train)
    X_test = scaler.transform(X_test)

    # 3. Initialize and Train the KNN Model
    knn = KNeighborsClassifier(n_neighbors=5)
    knn.fit(X_train, y_train)

    # 4. Predictions
    y_pred = knn.predict(X_test)

    # 5. Evaluation Metrics
    print("Accuracy:", accuracy_score(y_test, y_pred))
    print("Classification Report:\n", classification_report(y_test, y_pred))
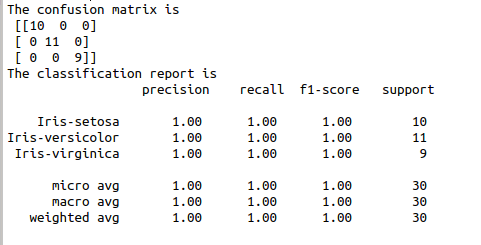
    print("Confusion Matrix:\n", confusion_matrix(y_test, y_pred))

    # 6. Heatmap for Confusion Matrix
    cm = confusion_matrix(y_test, y_pred)
    sns.heatmap(cm, annot=True, fmt="d", cmap="Blues", xticklabels=data.target_names, yticklabels=data.target_names)
    plt.title("Confusion Matrix Heatmap")
    plt.xlabel('Predicted')
    plt.ylabel('True')
    plt.show()

    # 7. Plot Decision Boundaries (for 2D features)
    X_train_2d = X_train[:, :2] # Use only the first two features for visualization
    X_test_2d = X_test[:, :2]

    # Fit the model again using the 2D data
    knn_2d = KNeighborsClassifier(n_neighbors=5)
    knn_2d.fit(X_train_2d, y_train)

    # Create a meshgrid for plotting decision boundaries
    x_min, x_max = X_train_2d[:, 0].min() - 1, X_train_2d[:, 0].max() + 1
    y_min, y_max = X_train_2d[:, 1].min() - 1, X_train_2d[:, 1].max() + 1
    xx, yy = np.meshgrid(np.arange(x_min, x_max, 0.1), np.arange(y_min, y_max, 0.1))

    # Predict for each point in the meshgrid
    Z = knn_2d.predict(np.c_[xx.ravel(), yy.ravel()])
    Z = Z.reshape(xx.shape)

    # Plot decision boundaries
    plt.contourf(xx, yy, Z, alpha=0.4)
    plt.scatter(X_train_2d[:, 0], X_train_2d[:, 1], c=y_train, marker='o', edgecolor='k', s=50)
    plt.title("KNN Decision Boundaries (2D features)")
    plt.xlabel(data.feature_names[0])
    plt.ylabel(data.feature_names[1])
    plt.show()
Screenshots
  • Accuracy Score