To predict whether the patient having breast cancer or not using machine learning in python.
Breast cancer data set. (Kaggle).
Import libraries.
Load the data.
Fix the independent and dependent variables.
Do scale the X variable.
Split the data into train and test.
Build the random forest model.
Fit the train data to the model.
Evaluate the model using test data.
Predict new data point.
#import libraries
import pandas as pd
import numpy as np
import matplotlib.pyplot as plt
import seaborn as sns
from sklearn.preprocessing import StandardScaler
from sklearn.model_selection import train_test_split
from sklearn.ensemble import RandomForestClassifier
from sklearn.metrics import classification_report, confusion_matrix, accuracy_score
#load data
data = pd.read_csv(‘…../cancer.csv’)
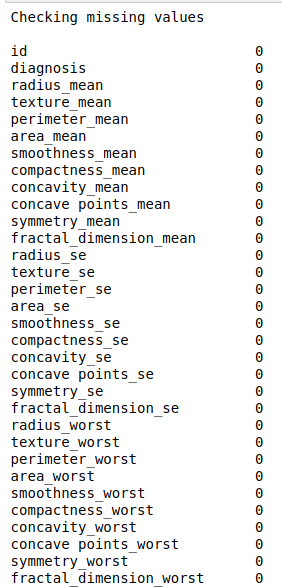
#check missing values
print(“Checking missing values\n”)
print(data.isnull().sum())
#make it as a data frame
df = pd.DataFrame(data)
print(“\n”)
#print data shape
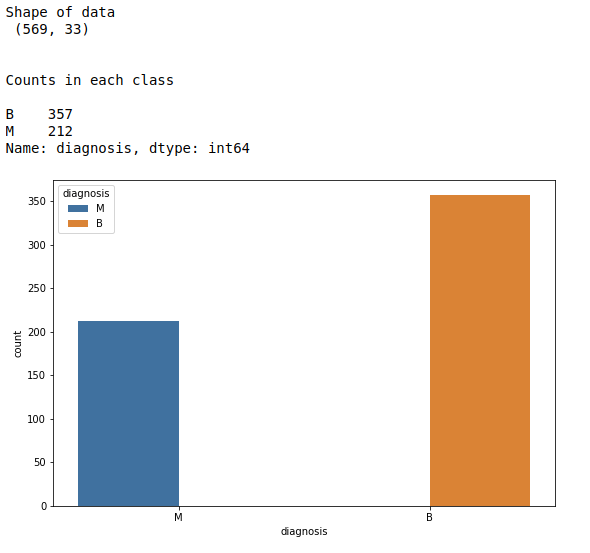
print(“Shape of data\n”,df.shape)
#counts in each class
print(“\n”)
print(“Counts in each class\n”)
count = df[‘diagnosis’].value_counts()
print(count)
#Count plot for target
plt.rcParams[“figure.figsize”] = [9,6]
sns.countplot(x=’diagnosis’,hue=”diagnosis”, data=df)
plt.show()
#Define X and y variable
X = df.iloc[:,2:32]
y = df.iloc[:,1]
#scale the input data
sc = StandardScaler()
X = sc.fit_transform(X)
#Split train and test data
X_train, X_test, y_train, y_test = train_test_split(X, y, test_size=0.2, random_state=0)
#training set and testing set
print(“\n”)
print(“Training data set\n”,X_train,”\n”,y_train)
print(“\n”)
print(“Testing data set\n”,X_test)
#Build the classifier
classifier = RandomForestClassifier(n_estimators=10000,random_state=42,n_jobs=-1)
#train the classifier
classifier.fit(X_train,y_train)
#predict the test data
y_pred = classifier.predict(X_test)
#Evaluate the model
print(“\n”)
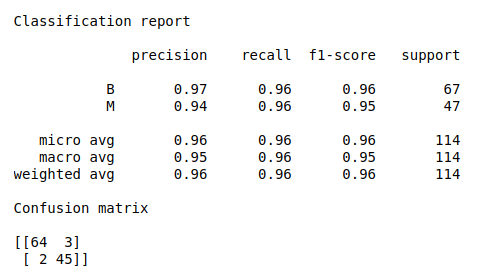
print(“Classification report\n”)
print(classification_report(y_test, y_pred))
print(“Confusion matrix\n”)
print(confusion_matrix(y_test, y_pred))
print(“\n”)
print(“Accuracy score”)
print(accuracy_score(y_test, y_pred)*100)
print(“\n”)
#Precision calulation from scratch
cm = confusion_matrix(y_test, y_pred)
print(“Precision:\n”)
def precision(cm):
p = (cm[0][0]/((cm[0][0])+(cm[1][0])))
if (str(p) == ‘nan’):
print(“Precision B – “,”0.00”)
else:
print(“Precision B – “,round(p*100,2))
precision(cm)
def precision1(cm):
p1 = (cm[1][1]/((cm[1][1])+(cm[0][1])))
if (str(p1) == ‘nan’):
print(“Precision M – “,”0.00”)
else:
print(“Precision M – “,round(p1*100,2))
precision1(cm)
#recall calculation
print(“\n”)
print(“Recall:\n”)
def recall(cm):
p = (cm[0][0]/((cm[0][0])+(cm[0][1])))
if (str(p) == ‘nan’):
print(“Recall B – “,”0.00”)
else:
print(“Recall B – “,round(p*100,2))
recall(cm)
def recall1(cm):
p1 = (cm[1][1]/((cm[1][1])+(cm[1][0])))
if (str(p1) == ‘nan’):
print(“Recall M – “,”0.00”)
else:
print(“Recall M – “,round(p1*100,2))
recall1(cm)
#predict new comment
print(“\n”)
print(“New prediction”)
new = [[15.34,14.26,102.5,704.4,0.1073,0.2135,0.2077,0.09756,0.2521,0.07032,0.4388,0.7096,3.384,44.91,0.006789, 0.05328,0.06446,0.02252,0.03672,0.004394,18.07,19.08,125.1,980.9,0.139,0.5954,0.6305,0.2393,0.4667,0.09946]]
new_pred = classifier.predict(new)
print(“Prediction for new data point”,new_pred)


