Research Breakthrough Possible @S-Logix
Office Address
- 2nd Floor, #7a, High School Road, Secretariat Colony Ambattur, Chennai-600053 (Landmark: SRM School) Tamil Nadu, India
- pro@slogix.in
- +91-81240 01111
To create heatmap plot using R programming.
Mainly used for Cluster analysis.
It substitutes numbers with coloured cells
R Package :gplots
R Function : heatmap(x, scale=, xlab= ,ylab= , main= ,col= )
x: Data set(mtcars)
Scale: character indicating if the valuesshould be centered and scaled ineither the row direction or the column direction, or none.
xlab: Label for x
ylab: Label for y
main: title of the graph
#Heat Map
#Input
attach(mtcars)
input<-as.matrix(mtcars)
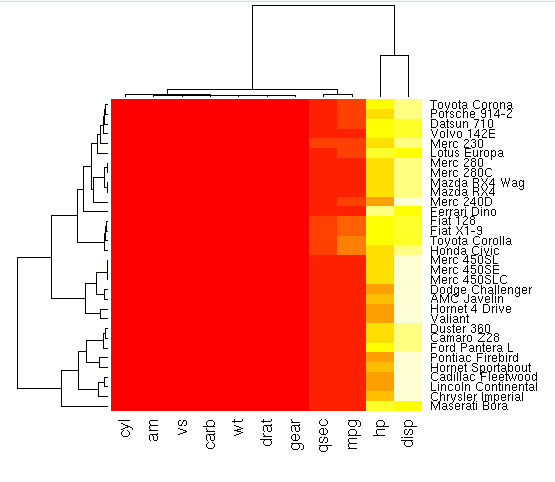
#heatmap
heatmap(input)
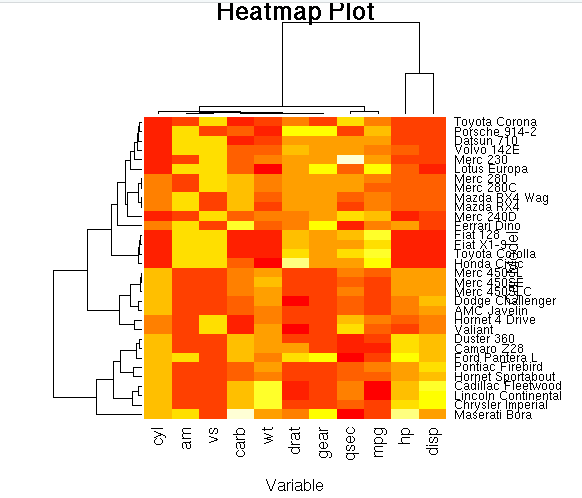
#Adding Scale and Labels
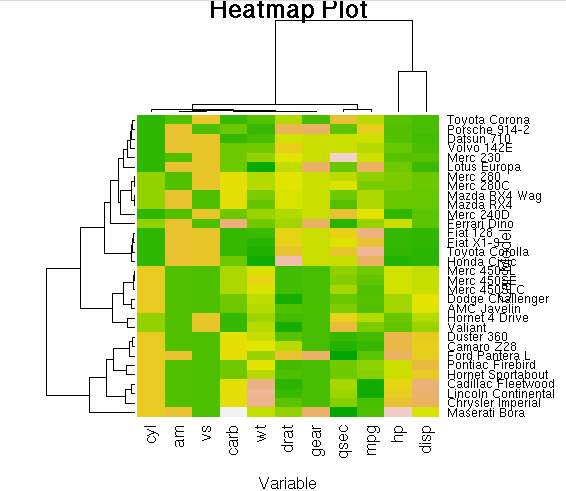
heatmap(input,scale=”column”,xlab = “Variable”,ylab = “Car Model”,main=”Heatmap Plot”)
#Changing color
heatmap(input,scale=”column”,xlab = “Variable”,ylab = “Car Model”,main=”Heatmap Plot”,col=terrain.colors(256))