Research breakthrough possible @S-Logix
pro@slogix.in
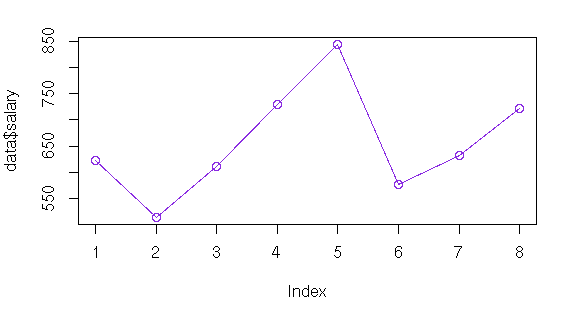
How to create line graph for the given data using R programming.
A line chart is a graph that connects a series of points by drawing line segments between them.
R Function : plot()
More than one line can be drawn on the same chart by using the lines() function.
#Data Visualization in Line Graph
#Read File
print(getwd())
setwd(“/home/soft13″)
print(getwd())
data<-read.csv(‘input.csv’)
print(data)
#Line Graph
plot(data$salary,type=”o”,col=”blueviolet”)
#Lines
number<-c(822,734,840,740,890,735,635,924)
lines(number,type=”l”,col=”chocolate2″)

