Research Breakthrough Possible @S-Logix
Office Address
- 2nd Floor, #7a, High School Road, Secretariat Colony Ambattur, Chennai-600053 (Landmark: SRM School) Tamil Nadu, India
- pro@slogix.in
- +91-81240 01111
To implement the Scatter3D using plot3D package in R programming.
R Package : plot3D
R Function : scatter3D()
R Function : text3D()
R Function : points3D()
R Function : text2D()
R Function : scatter2D()
x, y, z -- vectors of point coordinates
colvar -- a variable used for coloring
col -- color palette used for coloring the colvar variable
labels --the text to be written
add -- logical. If TRUE, then the points will be added to the current plot.If FALSE a new plot is started
pch -- changes point shapes
cex -- changes the size of points
f -- full box
b -- default value. Only theU back panels are visible
b2 -- back panels and grid lines are visible
g -- grey background with white grid lines
bl -- black background
bl2 -- black background with grey lines
u -means that the user will specify the arguments col.axis, col.panel, lwd.panel, col.grid, lwd.grid manually
n -- no box will be drawn. This is the same as setting box = FALSE
Color Palettecol(n, alpha): generates the matlab-type colors.
This is the default color palette used in plot3Dcol(n, alpha): similar to jet.col() but lacks the deep blue colors col(n, alpha)and gg2.col(n, alpha) generates gg-plot-like colors
col(col = c(grey, black), n, alpha): creates color schemes by interpolation col(col = grey, alpha): creates transparent colors Tick Markssimple draws just an arrow parallel to the axis to indicate direction of increase
detailed draws normal ticks and labels
nticks: the number of tick marks to draw on the axes. It has no effect if ticktype =simple.
#Scatter Plot 3D
#Installing required packages
#install.packages(“plot3D”)
library(“plot3D”)
#Functions for scatter plots 3D
x<-mtcars$mpg
y<-mtcars$disp
z<-mtcars$hp
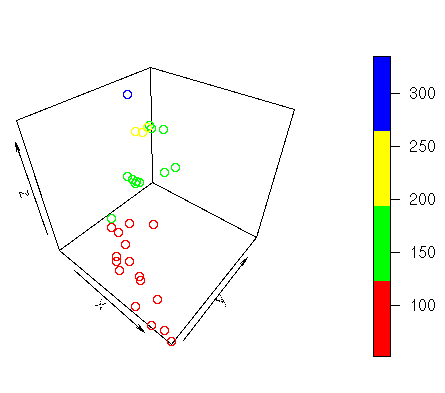
#Scatter3D
scatter3D(x,y,z,col=c(“red”,”green”,”yellow”,”blue”),add=FALSE)
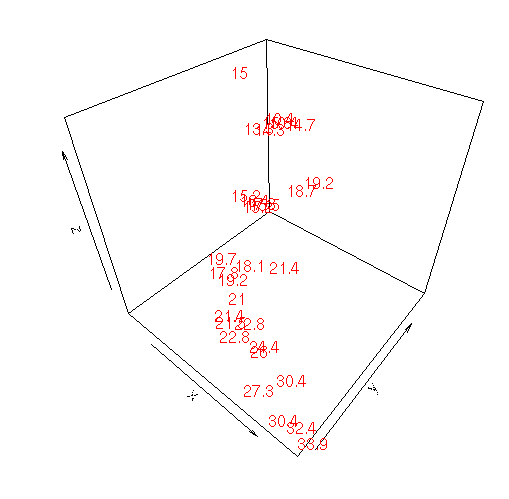
#Text3D
text3D(x,y,z,labels=x,col=”red”,add=FALSE)
text3D(x,y,z,labels=x,col=”red”,add=TRUE)
#Points3D
points3D(x,y,z)
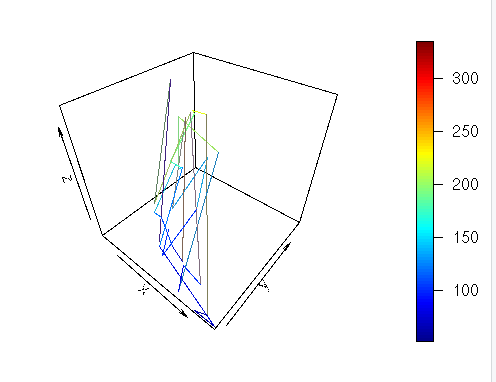
#Lines3D
lines3D(x,y,z)
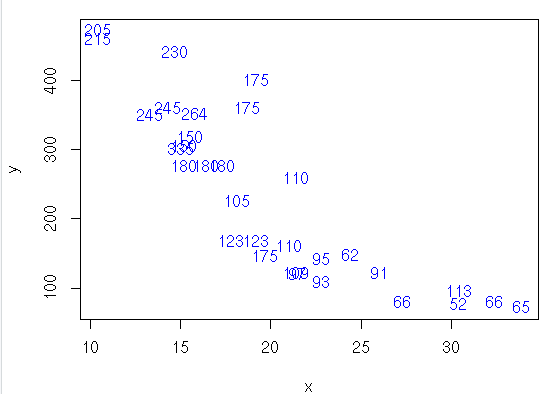
#Text2D
text2D(x,y,z,col=”blue”)
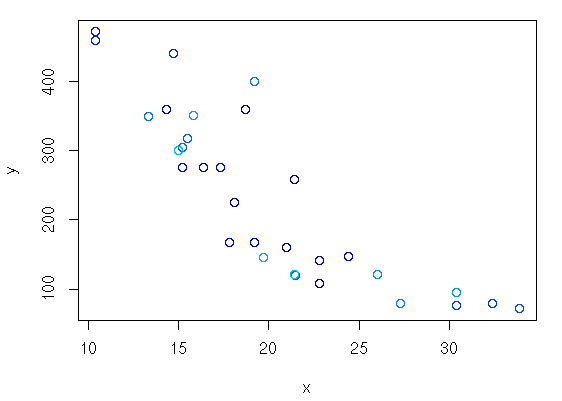
#scatter2D
scatter2D(x,y,z)
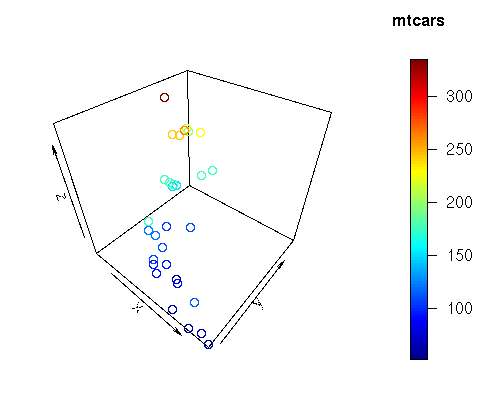
#Adding title of legend
scatter3D(x,y,z, clab = “mtcars”)
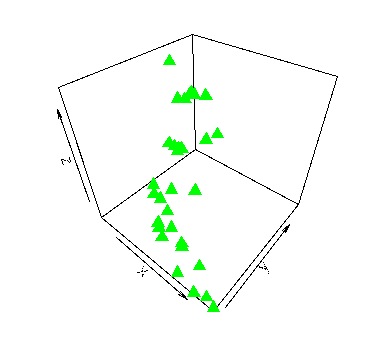
#Changing color of points
scatter3D(x,y,z,colvar=NULL,col=”green”,pch=17,cex=1.5)
#Changing box type
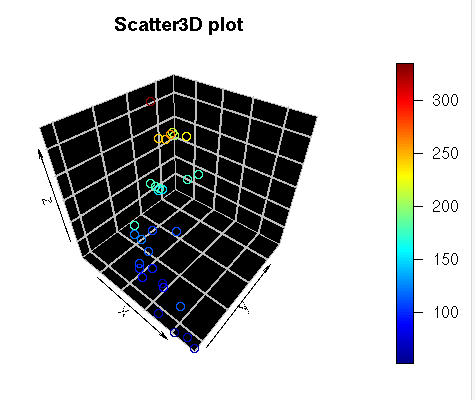
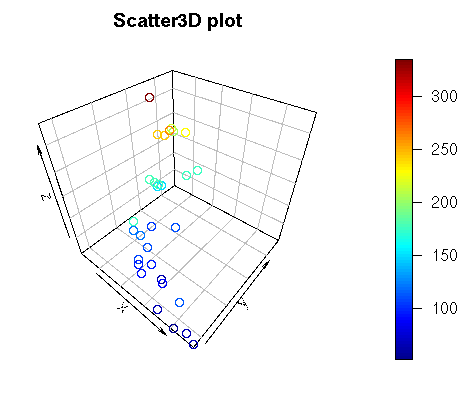
scatter3D(x,y,z,main=”Scatter3D plot”,bty=”b2″)
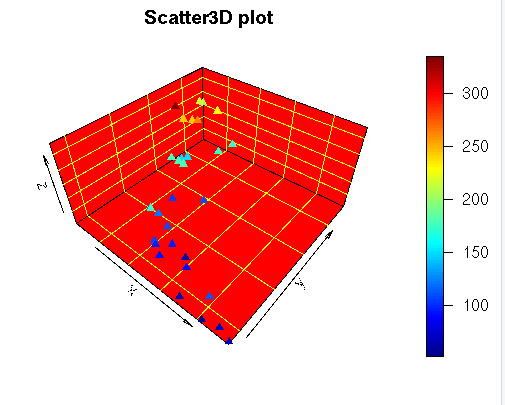
scatter3D(x,y,z,main=”Scatter3D plot”,bty=”bl2″)
scatter3D(x,y,z,main=”Scatter3D plot”,bty=”u”,pch=17,col.panel=26,col.grid=55,expand=0.5)
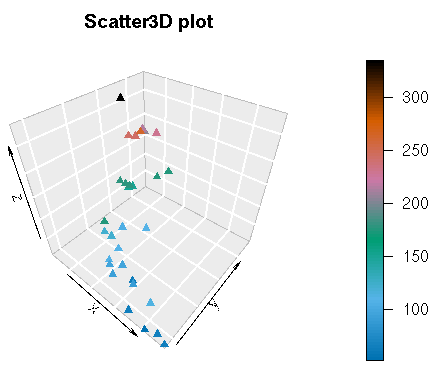
#ColorPalette
scatter3D(x,y,z,main=”Scatter3D plot”,bty=”g”,col=gg.col(100),pch=17)
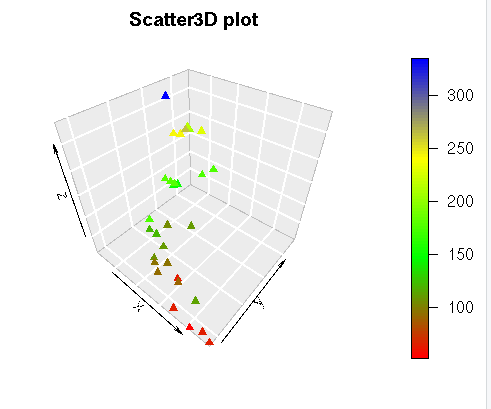
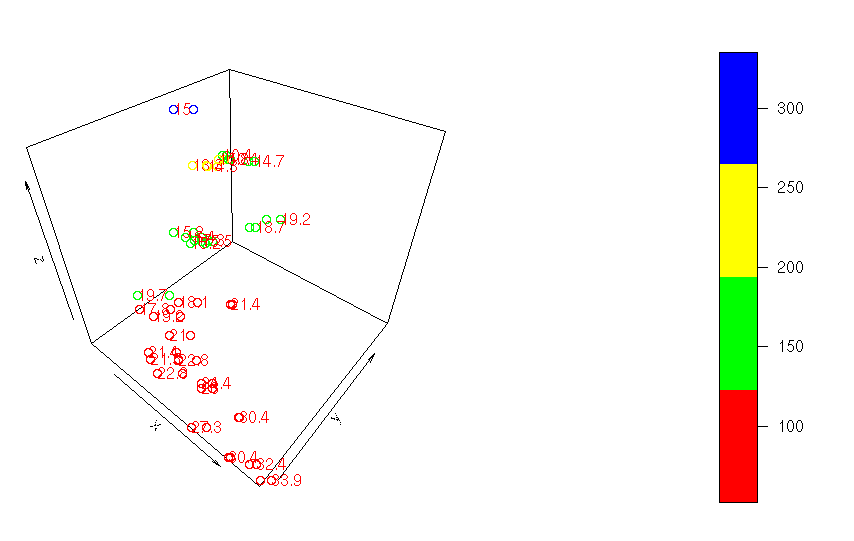
scatter3D(x,y,z,main=”Scatter3D plot”,bty=”g”,col=ramp.col(c(“red”,”green”,”yellow”,”blue”)),pch=17)
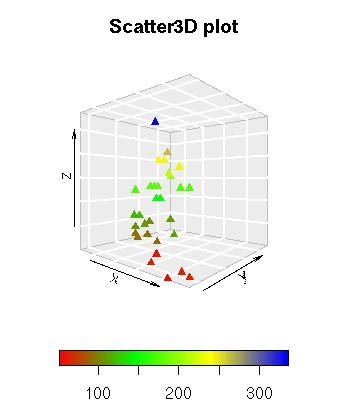
#Changing position of legend
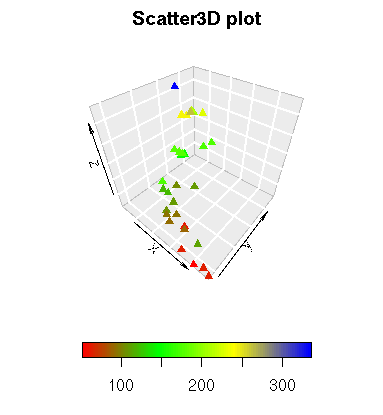
scatter3D(x,y,z,main=”Scatter3D plot”,bty=”g”,col=ramp.col(c(“red”,”green”,”yellow”,”blue”)),pch=17,colkey = list(side=1,length=0.5))
#3D Viewing Direction
scatter3D(x,y,z,main=”Scatter3D plot”,bty=”g”,col=ramp.col(c(“red”,”green”,”yellow”,”blue”)),pch=17,colkey = list(side=1,length=0.5),phi=0)
scatter3D(x,y,z,main=”Scatter3D plot”,bty=”g”,col=ramp.col(c(“red”,”green”,”yellow”,”blue”)),pch=17,colkey = list(side=1,length=0.5),theta = 20)
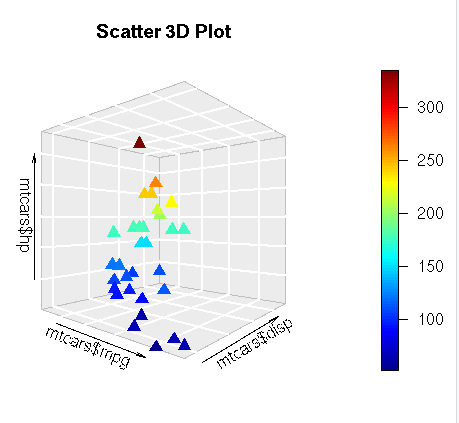
#Title and axis labels
scatter3D(x,y,z,main=”Scatter 3D Plot”,xlab=”mtcars$mpg”,ylab=”mtcars$disp”,zlab=”mtcars$hp”,phi=0,pch=17,cex=1.5,bty=”g”)
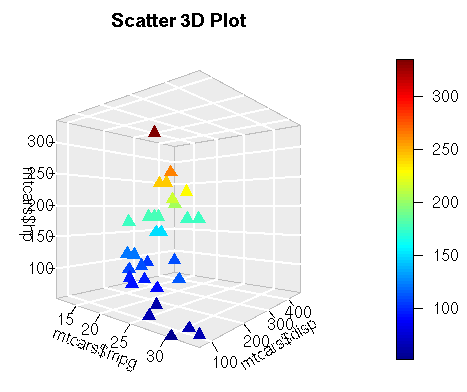
#Adding tickmarks
scatter3D(x,y,z,main=”Scatter 3D Plot”,xlab=”mtcars$mpg”,ylab=”mtcars$disp”,zlab=”mtcars$hp”,phi=0,pch=17,cex=1.5,bty=”g”,ticktype=”simple”)
scatter3D(x,y,z,main=”Scatter 3D Plot”,xlab=”mtcars$mpg”,ylab=”mtcars$disp”,zlab=”mtcars$hp”,phi=0,pch=17,cex=1.5,bty=”g”,ticktype=”detailed”)
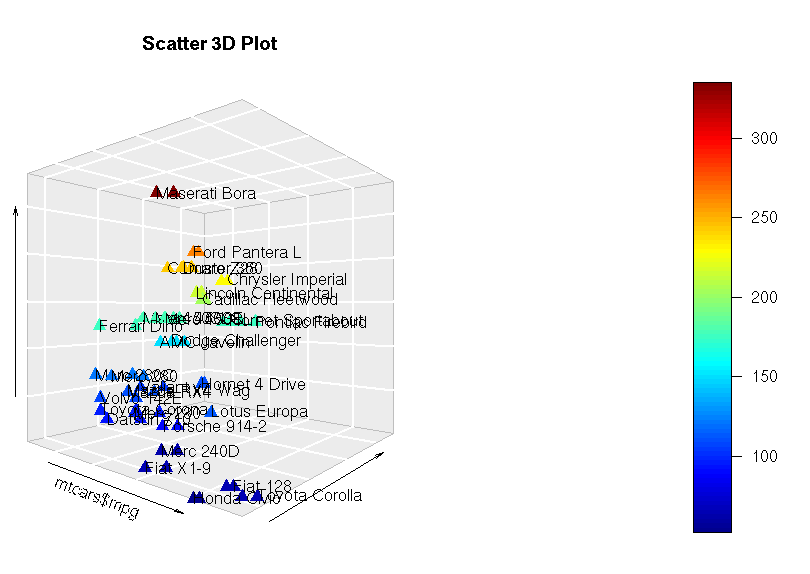
#Adding text
scatter3D(x,y,z,main=”Scatter 3D Plot”,xlab=”mtcars$mpg”,ylab=”mtcars$disp”,zlab=”mtcars$hp”,phi=0,pch=17,cex=1.5,bty=”g”,ticktype=”simple”)
text3D(x,y,z,labels=rownames(mtcars),add=TRUE)