Research Breakthrough Possible @S-Logix
Office Address
- 2nd Floor, #7a, High School Road, Secretariat Colony Ambattur, Chennai-600053 (Landmark: SRM School) Tamil Nadu, India
- pro@slogix.in
- +91-81240 01111
To manipulate the data using dplyr package in R programming.
#Data Manipulation using plyr package
#Loading required Packages
#install.packages(“dplyr”)
library(“dplyr”)
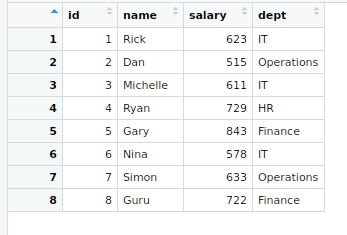
#Input data set
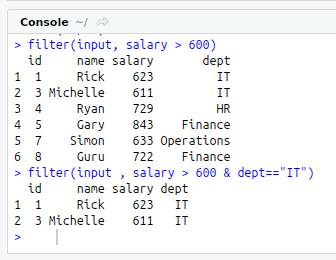
input<-read.csv(“my_input.csv”) View(input) #Function : filter filter(input, salary > 600)
filter(input , salary > 600 & dept==”IT”)
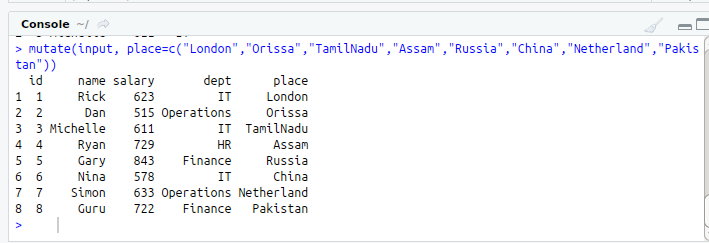
#Function : mutate
mutate(input, place=c(“London”,”Orissa”,”TamilNadu”,”Assam”,”Russia”,”China”,”Netherland”,”Pakistan”))
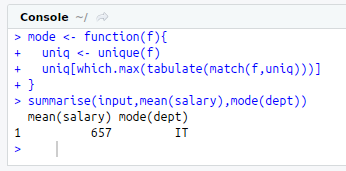
#Function : summarise
mode<-function(f){
uniq<-unique(f)
uniq[which.max(tabulate(match(f,uniq)))]
}
summarise(input,mean(salary),mode(dept))
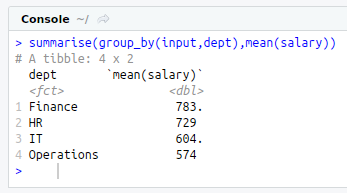
#Function group_by
summarise(group_by(input,dept),mean(salary))
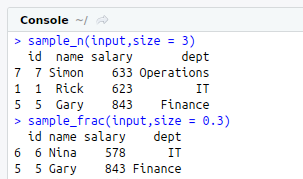
#Function : sample_n
sample_n(input,size = 3)
#Function sample_frac
sample_frac(input,size = 0.3)
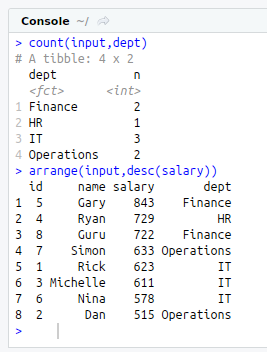
#Function : count
count(input,dept)
#Function : arrange
arrange(input,desc(salary))
#Operator : pipe
#Without pipe operator
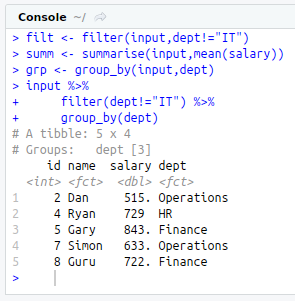
filt<-filter(input,dept!=”IT”)
summ<-summarise(input,mean(salary))
grp<-group_by(input,dept) #With pipe operator input %>%
filter(dept!=”IT”) %>%
group_by(dept)
summarise(mean(salary))