Research Breakthrough Possible @S-Logix
Office Address
- 2nd Floor, #7a, High School Road, Secretariat Colony Ambattur, Chennai-600053 (Landmark: SRM School) Tamil Nadu, India
- pro@slogix.in
- +91-81240 01111
To measure the dispersion of the given data in R programming.
#Measure of Dispersion
#Read File
print(getwd())
setwd(“/home/sof#Measure of Dispersion
#Read File
print(getwd())
setwd(“/home/soft13″)
print(getwd())
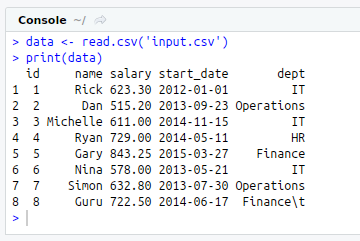
data<-read.csv(‘input.csv’)
print(data)
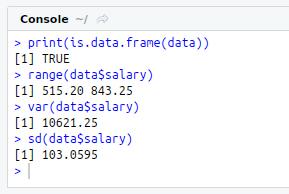
print(is.data.frame(data))
#Range
range(data$salary)
#Variance
var(data$salary)
#Standard Deviation
sd(data$salat13”)
print(getwd())
data<-read.csv(‘input.csv’)
print(data)
print(is.data.frame(data))
#Range
range(data$salary)
#Variance
var(data$salary)
#Standard Deviation
sd(data$salary)