To resolve the outliers in R programming.
Outliers are points that are distant from remaining observations.
Need of detecting Outliers:They can potentially skew or bias any analysis performed on the dataset.
It is therefore very important to detect and adequately deal with outliers.
Package and Function:R Package : outliers
R Function : outlier(x,opposite =) --
Extreme most observation from the mean.
X -- Data Frame
Opposite -- logical value, fetches outlier from the other side.
R Function : scores(x,type= chi-sq,z,t )
Type -- Normalized Scores based on type.
#Resolving Outlier
#Detecting Outlier
#install.packages(“outliers”)
library(“outliers”)
#Input
vect<-mtcars$mpg
x<-data.frame(vect)
print(x)
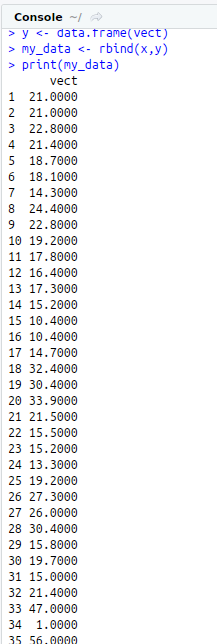
#Add some dummy outlier to input data
vect<-c(47,1,56,0.0272)
y<-data.frame(vect)
my_data<-rbind(x,y)
print(my_data)
#Outlier
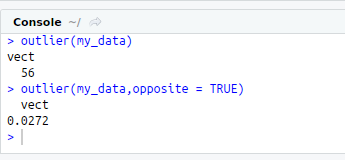
outlier(my_data)
#Outlier from other side
outlier(my_data,opposite = TRUE)
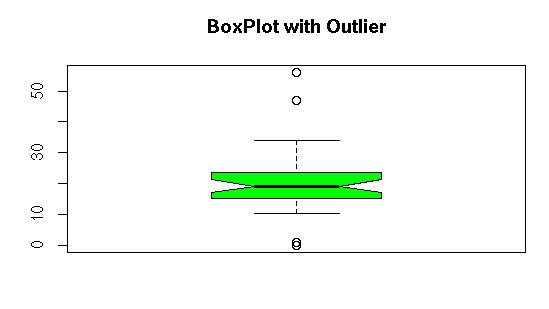
#Visualizing Outlier using Boxplot
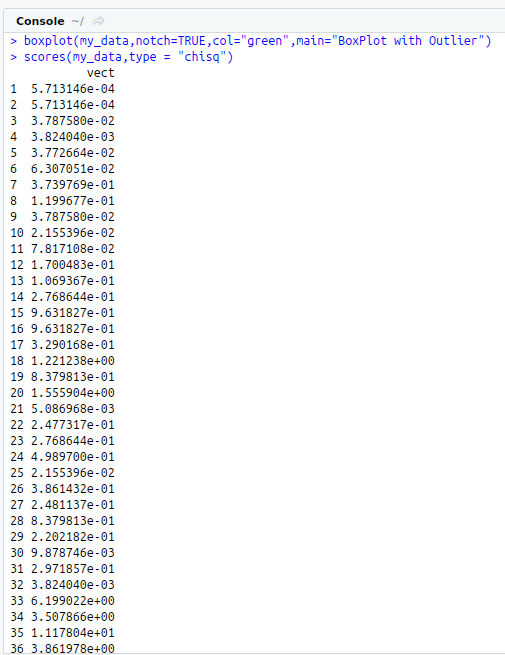
boxplot(my_data,notch=TRUE,col=”green”,main=”BoxPlot with Outlier”)
#Chi-Squared Scores
scores(my_data,type = “chisq”)
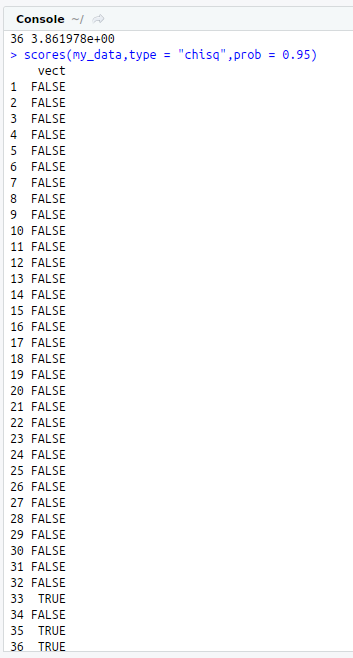
#Beyond 95th Percentile based on Chi-Square
scores(my_data,type = “chisq”,prob = 0.95)
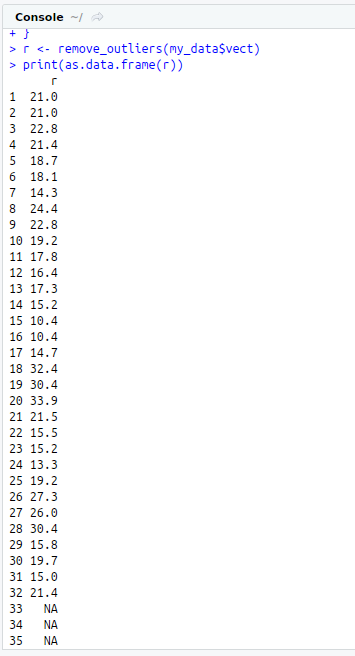
#Replacing Outlier with NA values
remove_outliers<-function(x,na.rm=TRUE) {
qnt<-quantile(x, probs=c(.25, .75))
H<-1.5 * IQR(x, na.rm = na.rm)
y<-x
y[x < (qnt[1] – H)]<-NA
y[x > (qnt[2] + H)]<-NA
y
}
r<-remove_outliers(my_data$vect)
print(as.data.frame(r))
print(my_data)
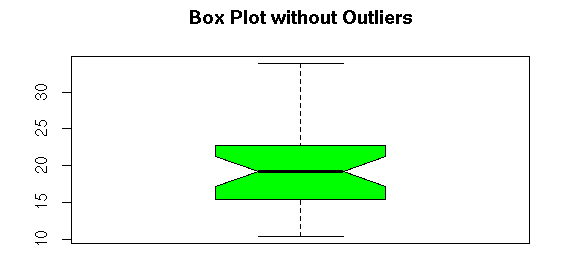
#Box Plot witout Outlier
boxplot(r,notch=TRUE,col=”green”,main=”Box Plot without Outliers”)
