Research Breakthrough Possible @S-Logix
Office Address
- 2nd Floor, #7a, High School Road, Secretariat Colony Ambattur, Chennai-600053 (Landmark: SRM School) Tamil Nadu, India
- pro@slogix.in
- +91-81240 01111
To display a hand written image in R
Keras MNIST data set
Load required libraries
Load the data set(Here the keras built in dataset MNIST is used)
The MNIST data set is a data set of 60,000 28x28 grayscale images of the 10 digits
Initialize the color palette
Use the function par() to set or query graphical parameters along with its arguments
Display the image
#loading keras library
library(keras)
#loading the keras inbuilt mnist dataset
data<-dataset_mnist()
train_x<-data$train$x
train_y<-data$train$y
##Color ramp
colors<-c(‘white’,’black’)
cus_col<-colorRampPalette(colors=colors)
## Plot the average image of each digit
par(mfrow=c(4,3),pty=’s’,mar=c(1,1,2,1),xaxt=’n’,yaxt=’n’)
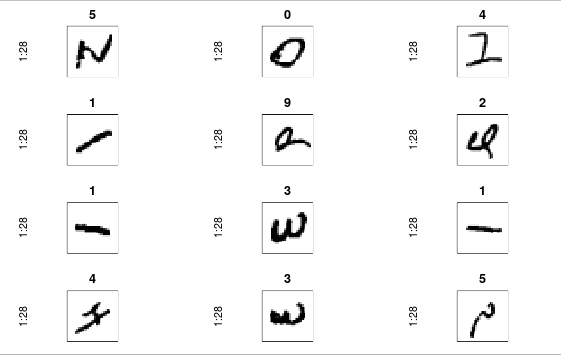
#Digits before transposing and transforming the matrix
for(di in 1:12)
{
image(1:28,1:28,train_x[di,,],main=train_y[di],col=cus_col(256))
}
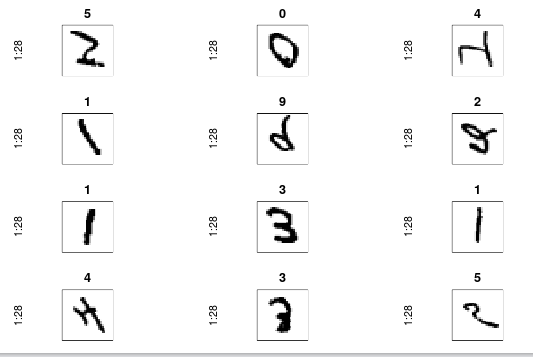
#Digits after transposing matrix
for(di in 1:12)
{
image(1:28,1:28,t(train_x[di,,]),main=train_y[di],col=cus_col(256))
}
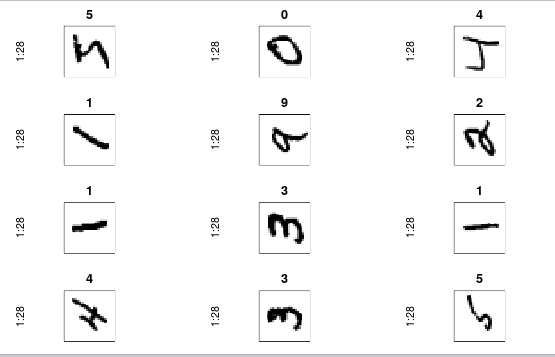
#Digits after transforming the matrix
for(di in 1:12)
{
image(1:28,1:28,train_x[di,,][,28:1],main=train_y[di],col=cus_col(256))
}
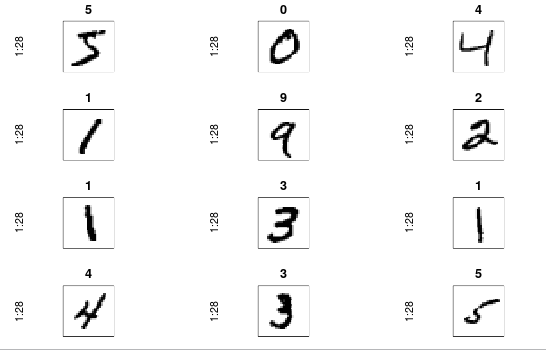
#Digits after transposing and transforming the matrix
for(di in 1:12)
{
image(1:28,1:28,t(train_x[di,,])[,28:1],main=train_y[di],col=cus_col(256))
}