Research Breakthrough Possible @S-Logix
Office Address
- 2nd Floor, #7a, High School Road, Secretariat Colony Ambattur, Chennai-600053 (Landmark: SRM School) Tamil Nadu, India
- pro@slogix.in
- +91-81240 01111
To implement the kmeans clustering for the given data set using R programming.
In unsupervised learning all the data are unlabelled.
It have input data (x) and no corresponding output (y) variable.
Its goal is to model the underlying structure of the data and to distribute the data.
In order to learn more about the data.
It is grouped into Clustering and Association.
Clustering:To discover groupings in the dataset.
Grouping customers by purchasing behavior.
Centroid based Algorithms : K-means,hierarchical algorithm.
K-means Clustering algorithm:It is a type of Unsupervised learning.
One of the clustering algorithm
It is a centroid based algorithm
To find Patterns in the data.
Steps in K-means Clustering:Step 1: Import data.
Step 2: Data Preparation
Step 3: Compute kmeans
Step 4: Ploting the result.
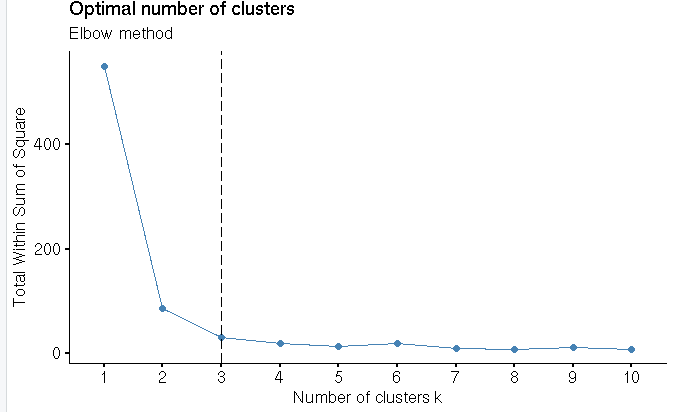
Step 5: Finding the optimal number of clusters.
Package and Functions:R Package :ggplot2--For Visualization
R Package : animation--For animatic visualization
R Package :factoextra--For data manipulation and visualization.
R Package : NbClust--For Visualizing the number of clusters.
R Function : sum(is.na(data))--to return the number of missing values.
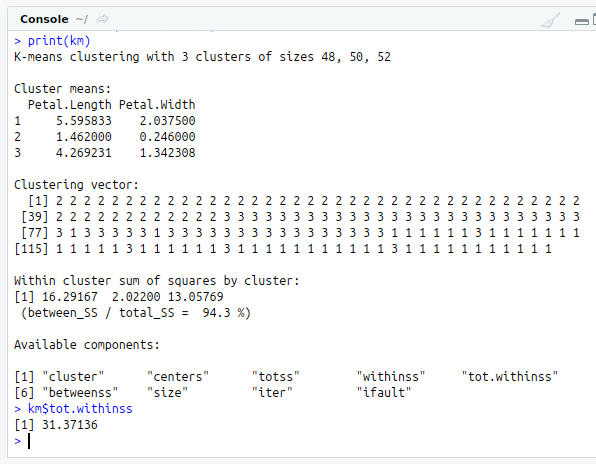
R Function : kmeans(data,centers=,nstart= )-- to compute kmeans.
data--data set to be clustered
centers--No.of Clusters to be formed
nstart --No.of random sets to be chosen initially.
R Function : fviz_nbclust(x,FUNcluster method=c(silhoutte,wss,gap_stat))-from factoextra package used to compute three different methods(silhoutte,elbow,gap statistic) for any partitioning clustering methods(k-means,k-mediods,HCUT)
R Function : par(mfrow=c())--to split the graph screen
#Clustering
#Input Data set
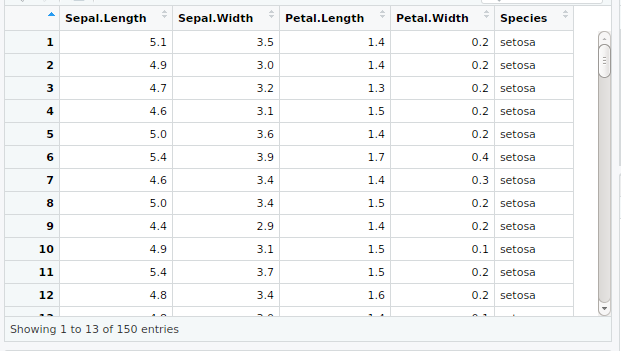
input View(input)
#Data Preparation
#Missing Values
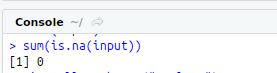
sum(is.na(input))
#ggplot
#install.packages(“ggplot2”)
library(“ggplot2”)
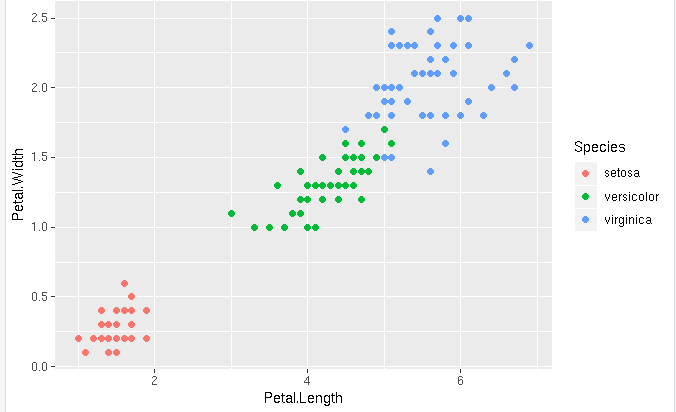
ggplot(input, aes(x=Petal.Length,y=Petal.Width,color
=Species)) +geom_point()
#kmeans
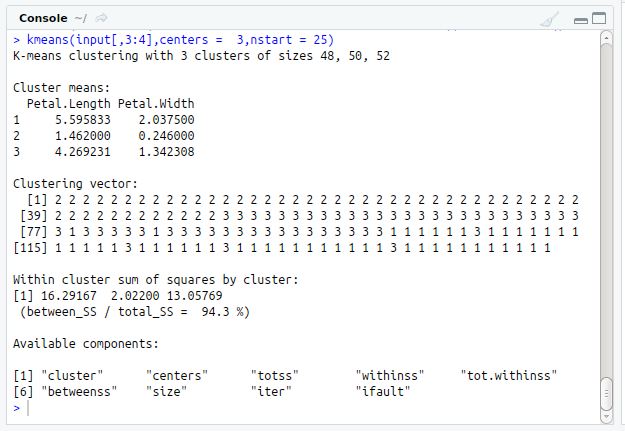
kmeans(input[,3:4],centers = 3,nstart = 25)
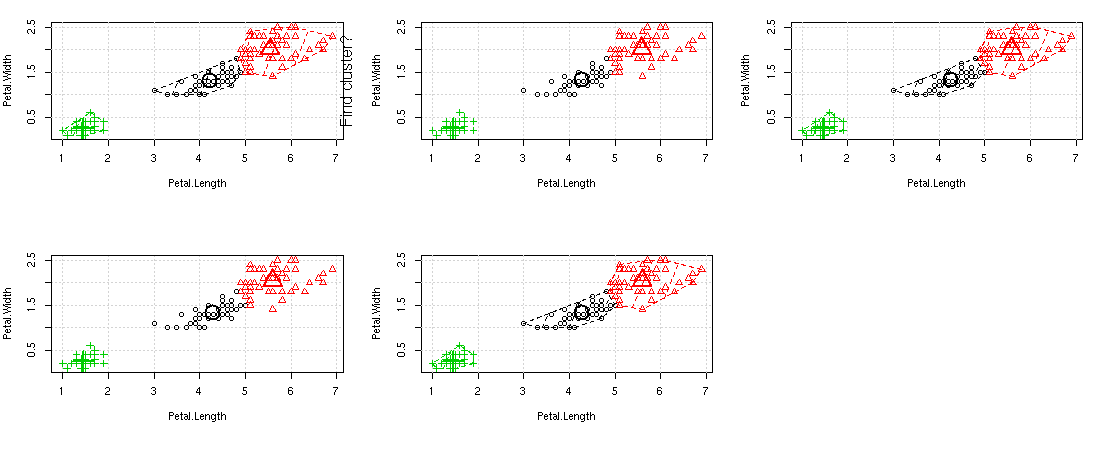
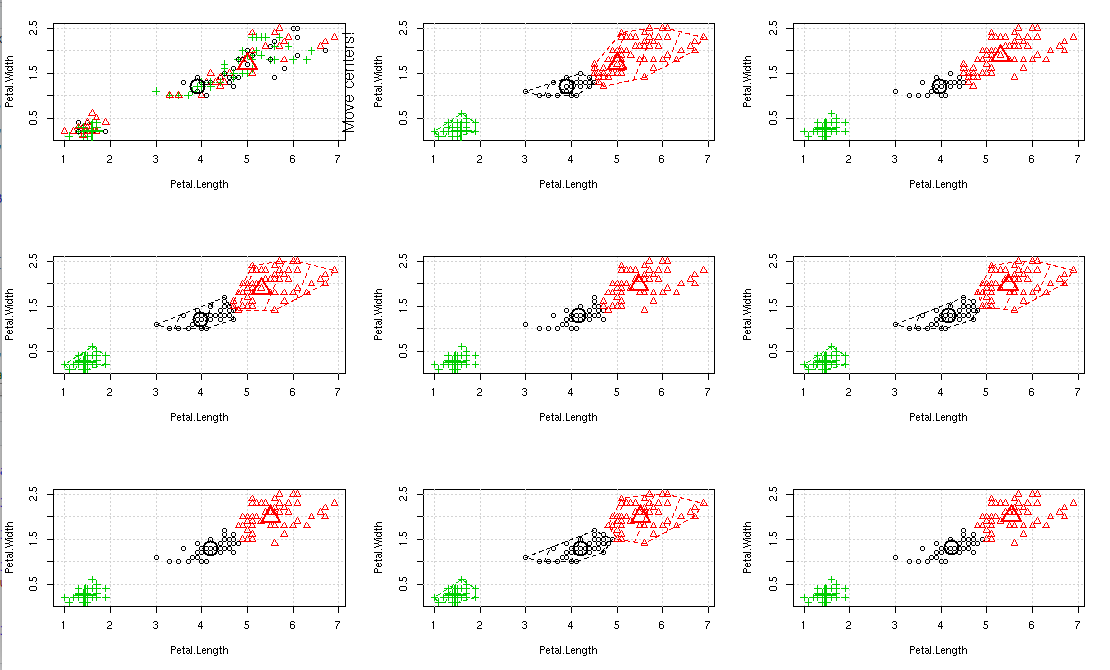
#install.packages(“animation”)
library(“animation”)
par(mfrow=c(3,3))
kmeans.ani(input[,3:4],3)
#Finding optimal k
km print(km)
km$tot.withinss
#Elbow method
#install.packages(“factoextra”)
library(“factoextra”)
#install.packages(“NbClust”)
library(“NbClust”)
fviz_nbclust(input[,3:4],kmeans,method = “wss”) + geom_vline(xintercept = 3,linetype=5) + labs(subtitle=”Elbow method”)