To calculate the mean,median,mode of the sample data in python.
It add together all of the numbers in a data set and then divide the sum by the total count of numbers.
To calculate the mean value using df.mean() python inbuilt function.
It arranging the data from smallest to largest.
After arranging it takes the middle data in a data set.
Find the median by averaging the two middle data.
To calculate the median value using df.median() python inbuilt function.
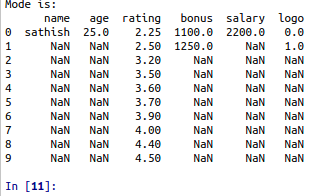
Its returns the frequently used data one or more time in a data set.
To calculate the mode value using df.mode() python inbuilt function.
#import pandas library
import pandas as pd
#load the data from CSV file
data=pd.read_csv(‘/home/soft27/soft27/
Sathish/Pythonfiles/Employee.csv’)
#creating the Data Frame
df=pd.DataFrame(data)
print(“Actual data from the CSV file:”)
print(df)
#Calculate the mean
print(“Mean is:”)
print(df.mean())
#Calculate the median
print(“Median is:”)
print(df.median())
#calculate the mode
print(“Mode is:”)
print(df.mode())


