Research breakthrough possible @S-Logix
pro@slogix.in
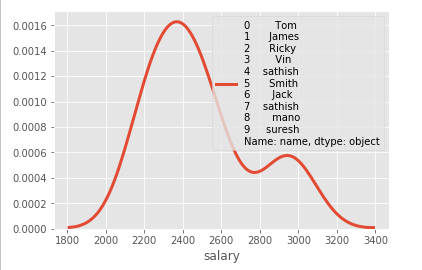
To create density plot for X variable using python.
Import seaborn library.
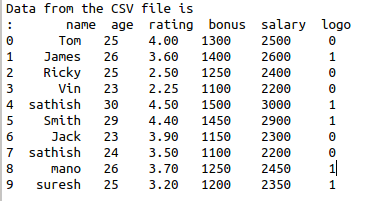
Read the data set.
Put the density plot.
#import library functions
import seaborn as sns
import pandas as pd
#Read the data set
data=pd.read_csv(‘/home/soft27/soft27/
Sathish/Pythonfiles/Employee.csv’)
#create data frame
df=pd.DataFrame(data)
print(“Data from the CSV file is\n”,df)
#density plot
sns.distplot(df[‘salary’], hist = False, kde = True,
kde_kws = {‘linewidth’: 3},label = df[‘name’])

