Research breakthrough possible @S-Logix pro@slogix.in

Office Address

Social List

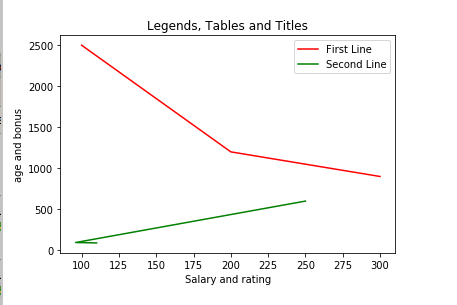
How to Implement Legends, Titles, and Labels

Legends, Titles and Labels Implementation

Description of Implementing Legends, Titles, and Labels

  • Description:
    In data visualization, adding legends, titles, and labels to your plot is important for clarity and better understanding of the information being presented. These elements provide context and help explain the plotted data.
Key Elements
  • Title: A title provides a brief description of the plot, giving the viewer an idea of what the plot represents.
  • Labels: Labels are used for the axes to indicate what each axis represents (e.g., "X-axis" and "Y-axis").
  • Legend: A legend is used to explain the different elements or categories present in the plot (e.g., color or line style representing different data series).
Step by StepProcess
  • Adding Title: Use the plt.title() function to add a title to the plot.
  • Adding Labels: Use the plt.xlabel() and plt.ylabel() functions to add labels to the x-axis and y-axis, respectively.
  • Adding Legends: Use the plt.legend() function to add a legend to the plot. You can specify labels for different plot elements (e.g., different lines, scatter points) and the plot will display a legend corresponding to those labels.
Sample Source Code
  • # Code for adding legends, titles and labels

    import matplotlib.pyplot as plt
    import pandas as pd

    data = {
    'Year': [2015, 2016, 2017, 2018, 2019, 2020],
    'Product A Sales': [100, 120, 130, 145, 160, 175],
    'Product B Sales': [80, 90, 110, 130, 155, 170]
    }
    df = pd.DataFrame(data)

    plt.plot(df['Year'], df['Product A Sales'], label='Product A', color='blue', linestyle='-', marker='o', linewidth=2)
    plt.plot(df['Year'], df['Product B Sales'], label='Product B', color='red', linestyle='--', marker='s', linewidth=2)

    # Add title
    plt.title('Sales of Product A and Product B (2015-2020)', fontsize=14, fontweight='bold')

    # Add axis labels
    plt.xlabel('Year', fontsize=12)
    plt.ylabel('Sales (in thousands)', fontsize=12)

    # Add a legend
    plt.legend(title="Products", loc='upper left', fontsize=10)

    plt.grid(True)
    plt.show()
Screenshots
  • Legends, Titles and Labels Implementation