Research Breakthrough Possible @S-Logix

Office Address
- 2nd Floor, #7a, High School Road, Secretariat Colony Ambattur, Chennai-600053 (Landmark: SRM School) Tamil Nadu, India
- pro@slogix.in
- +91-81240 01111
apply() and unique() for Sample Dataset Using Python



apply() and unique() in Pythonapply() function in Pandas is used to apply a function along an axis (rows or columns) of a DataFrame or Series. This is useful when you need to perform a custom operation on each row or column.unique() function is used to return the unique values in a DataFrame column or Series. It helps to quickly identify the distinct values present in the data.
apply():apply() function to apply any custom function to each row or column of a DataFrame or Series.DataFrame.apply(func, axis=0) where axis=0 applies the function to columns and axis=1 applies it to rows.
unique():unique() function returns an array of unique values in a particular column or Series.DataFrame['column_name'].unique()
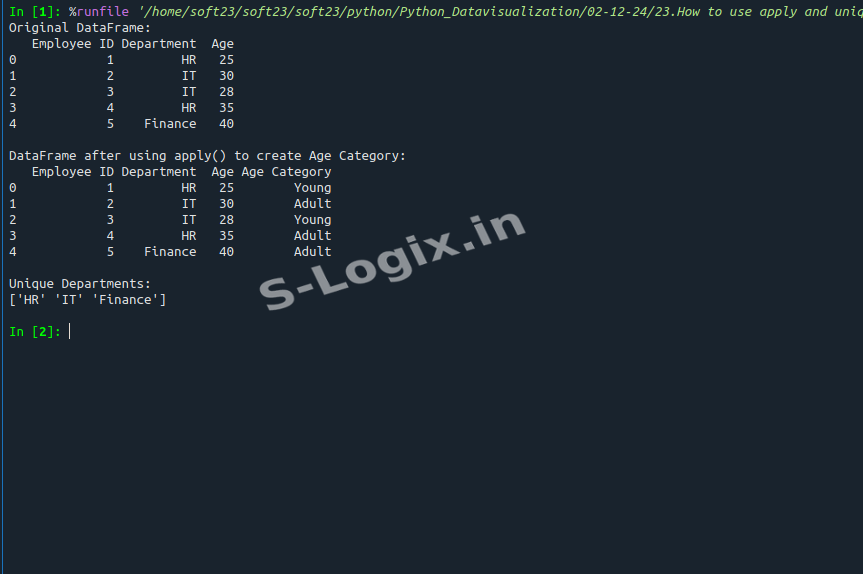
apply() to create a new column based on a custom functionapply() to create Age Category:")unique() to find the unique departments