Research breakthrough possible @S-Logix
pro@slogix.in
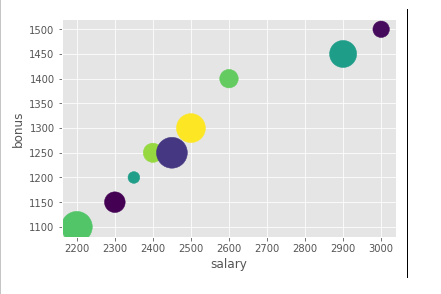
To plot bubble chart for given data sample using python.
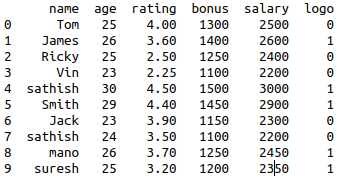
Read the sample data.
Import needed libraries.
Assign x,y,z for plotting.
Use plt.scatter() to plot the bubble chart.
#import libraries
import matplotlib.pyplot as plt
import numpy as np
import pandas as pd
#Read the sample data
data=pd.read_csv(‘/home/soft27/
Sathish/Pythonfiles/Employee.csv’)
#create data frame
df=pd.DataFrame(data)
#assign x variable
x = df[‘salary’]
#assign y variable
y = df[‘bonus’]
z = np.random.rand(10)
#pick random color
colors = np.random.rand(10)
#plot the bubble chart
plt.scatter(x, y, s=z*1000,c=colors)
plt.xlabel(‘salary’)
plt.ylabel(‘bonus’)
plt.show()

