Research breakthrough possible @S-Logix
pro@slogix.in
To plot explode pie chart for a data sample using python.
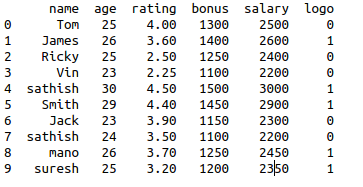
Read the sample data.
Store it in a data frame.
Declare the values of explode.
Define the plotting variables.
Use plt.pie() to plot explode pie chart.
#import libraries
import matplotlib.pyplot as plt
import pandas as pd
#read the data set
data=pd.read_csv(‘/home/soft27/soft27
/Sathish/Pythonfiles/Employee.csv’)
explode=(0.2,0.1,0.0,0.3,0.4,0.5,0.2,0.1,0.3,0.5)
#creating data frame
df=pd.DataFrame(data)
print(df)
#pie chart method and arguments
plt.pie(df[‘salary’],labels=df[‘name’],
explode=explode,startangle=
45,autopct=’%.1f%%’)
plt.show()

