Research Breakthrough Possible @S-Logix pro@slogix.in

Office Address

Social List

How to Plot Heatmaps in Python

Plotting Heatmaps in Python

Condition for Plotting Heatmaps in Python

  • Description:
    A heatmap is a data visualization technique that uses color to represent the values of a matrix or 2D array.

    It is especially useful for visualizing the correlation matrix, showing how strongly pairs of variables are related to each other.

    Steps: 1. Import necessary libraries
    2. Prepare the data
    3. Create the heatmap
    4. Customize the heatmap
    5. Display the heatmap
Step-by-Step Process
  • Import Necessary Libraries:
    Use seaborn and matplotlib for creating and displaying the heatmap.
  • Prepare Data:
    The data should be in a 2D format, such as a pandas DataFrame or a 2D list.
  • Create the Heatmap:
    Use `seaborn.heatmap()` to generate the heatmap.
  • Customize the Heatmap:
    Add annotations, customize the color palette, and configure labels for better readability.
  • Display the Heatmap:
    Use `plt.show()` to render the plot.
Sample Source Code
  • # Code for Heatmap

    import pandas as pd
    import numpy as np
    import seaborn as sns
    import matplotlib.pyplot as plt

    data = {
    'Math': [78, 85, 96, 80, 72],
    'Science': [84, 89, 92, 88, 76],
    'English': [68, 79, 85, 75, 70],
    'History': [72, 67, 78, 74, 65]
    }
    df = pd.DataFrame(data)

    correlation_matrix = df.corr()

    # Plot the heatmap
    plt.figure(figsize=(8, 6))
    sns.heatmap(
    correlation_matrix,
    annot=True,
    cmap='coolwarm',
    fmt='.2f',
    linewidths=0.5,
    cbar=True
    )

    plt.title('Correlation Matrix Heatmap')

    plt.show()
Screenshots
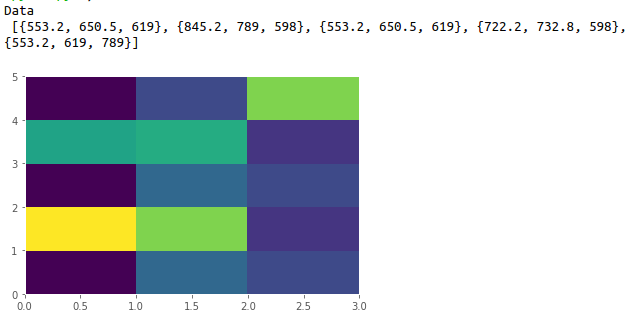
  • Heatmap Plot Output