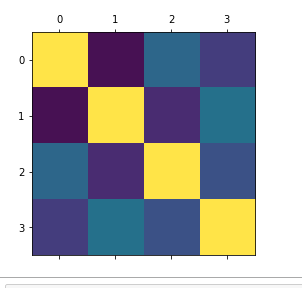
To plot the correlation matrix for a given data set using python.
Prepare the correlation matrix for the data frame.
Import matplot library.
Using plt.matshow() to plot the correlation matrix in python.
#import library function
import pandas as pd
#sample data
data={‘salary’:[1000,200,300,400,50,400,300,2000,
100,50],
‘age’:[25,26,25,23,30,29,23,23,25,25],
‘rating’:[4,3.24,2.5,2.25,2,2.25,2.5,2.75,3.2,4.2],
‘bonus’:[2500,1200,900,3000,1800,1400,850,250,750, 1000]}
#store in rows and column using pandas data frame
df=pd.DataFrame(data)
print(“Actual data frame is:”)
print(df)
#finding the correlation
correlation = df.corr(method=’pearson’)
print(“\n”)
print(“The correlation matrix is:\n”,correlation)
#plot the coefficients
plt.matshow(df.corr())
plt.show()
