List of Topics:
Research Breakthrough Possible @S-Logix pro@slogix.in

Office Address

Social List

How to Plot the Correlation Matrix Using Matplotlib Library

Correlation Matrix Heatmap

Condition for Plotting the Correlation Matrix Using Matplotlib Library

  • Description:
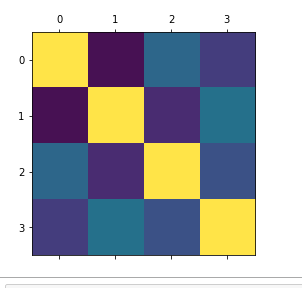
    A correlation matrix is a table that shows the correlation coefficients between many variables. It is a useful tool for identifying relationships between different variables in a dataset. The correlation matrix is often plotted as a heatmap to visualize the strength of correlations.
Step-by-Step Process
  • Import the Required Libraries:
    Use Pandas for handling the dataset, Matplotlib for basic plotting, and Seaborn for enhanced heatmap visualization.
  • Prepare the Data:
    Load or create the dataset and ensure it's in a numerical format for correlation analysis.
  • Compute the Correlation Matrix:
    Use the .corr() method from Pandas to compute the correlation matrix of the dataset.
  • Plot the Correlation Matrix:
    Use Matplotlib to generate a heatmap of the correlation matrix.
Sample Source Code
  • import pandas as pd

    import matplotlib.pyplot as plt
    import seaborn as sns

    data = {
    "Height": [5.5, 6.0, 5.7, 5.8, 6.2],
    "Weight": [150, 160, 155, 158, 170],
    "Age": [25, 30, 28, 35, 40]
    }
    df = pd.DataFrame(data)

    # Calculate the correlation matrix
    correlation_matrix = df.corr()

    plt.figure(figsize=(8, 6))
    sns.heatmap(correlation_matrix, annot=True, cmap='coolwarm', fmt='.2f', linewidths=0.5)

    plt.title('Correlation Matrix Heatmap')
    plt.show()
Screenshots
  • Correlation Matrix Heatmap Output