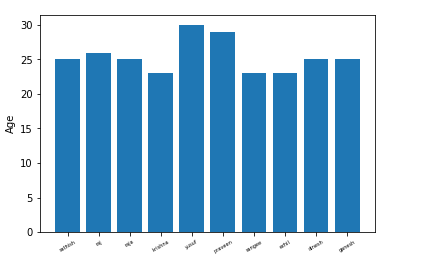
How to visualize data using bar chart in python.
import matplot library and then import sub package pyplot.
Load the data set.
Take two variables in the sample data.
Using plt.bar(arguments) to plot bar chart in python.
#import library
import matplotlib.pyplot as plt
import pandas as pd
import numpy as np
#10 sample data
data={‘name’:[‘sathish’,’raj’,’raja’,’krishna’
,’yusuf’,’praveen’,’sangee’,’ezhil’,’dinesh’,
‘ganesh’], ‘salary’:[100,200,300,400,500,400,
300,200,100,50],’age’:[25,26,25,23,30,29,23,
23,25,25], ‘rating’:[4,3.24,2.5,2.25,2,2.25,
2.5,2.75,3.2,4.2], ‘bonus’:[2500,1200,900,
3000,1800,1400,850,250,750, 1000]}
#creating data frame
df=pd.DataFrame(data)
#numpy method that generates an
array of sequential numbers
index = np.arange(len(df[‘name’]))
# this is for plotting purpose
plt.bar(index, df[‘age’])
plt.ylabel(‘Age’)
plt.xticks(index, df[‘name’],
fontsize=5, rotation=30)
plt.show()
