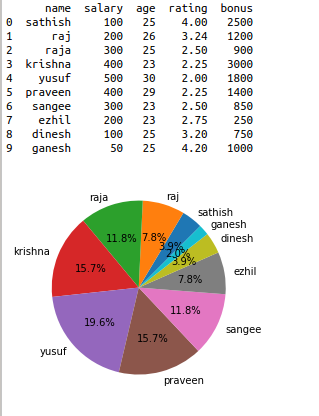
To visualize the data in pie chart using python
Import matplot library and then import sub package pyplot.
Load the data set.
Take two variables in the sample data.
Pass it into the pie chart method plt.pie(Arguments).
#import library
import matplotlib.pyplot as plt
import pandas as pd
#10 sample data
data={'name':['sathish','raj','raja','krishna',
'yusuf','praveen','sangee','ezhil','dinesh','ganesh'],
'salary':[100,200,300,400,500,400,
300,200,100,50],
'age':[25,26,25,23,30,29,23,23,25,25],
'rating':[4,3.24,2.5,2.25,2,2.25,2.5,2.75,3.2,4.2],
'bonus':[2500,1200,900,3000,
1800,1400,850,250,750, 1000]}
#creating data frame
df=pd.DataFrame(data)
print(df)
#calling the pie chart
method from matplot library
plt.pie(df['salary'], labels =
df['name'], startangle=45, autopct='%.1f%%')
plt.show()
