Research breakthrough possible @S-Logix
pro@slogix.in
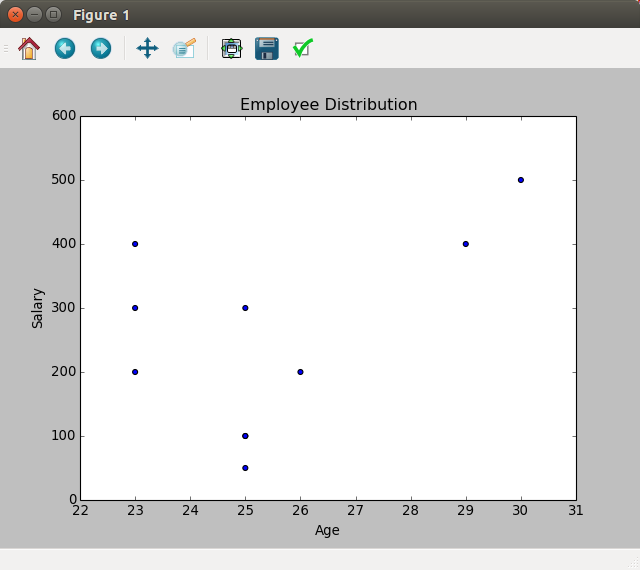
To visualize the data using scatter plot in python.
Load the data set.
Create the data frame to bind the data.
Calling scatter plot method,from matplotlib.pyplot.
#imported libraries
import matplotlib.pyplot as plt
import pandas as pd
#read CSV file
data=pd.read_csv
(‘/home/soft27/soft27/Sathish/
Pythonfiles/Employee.csv’)
#create the Data frame
df=pd.DataFrame(data)
#initialize the figure object
fig=plt.figure()
ax = fig.add_subplot(1,1,1)
#calling the scatter plot method
ax.scatter(df[‘Age’],df[‘Salary’])
plt.title(‘Employee Distribution’)
plt.xlabel(‘Age’)
plt.ylabel(‘Salary’)
plt.show()
