Research breakthrough possible @S-Logix
pro@slogix.in
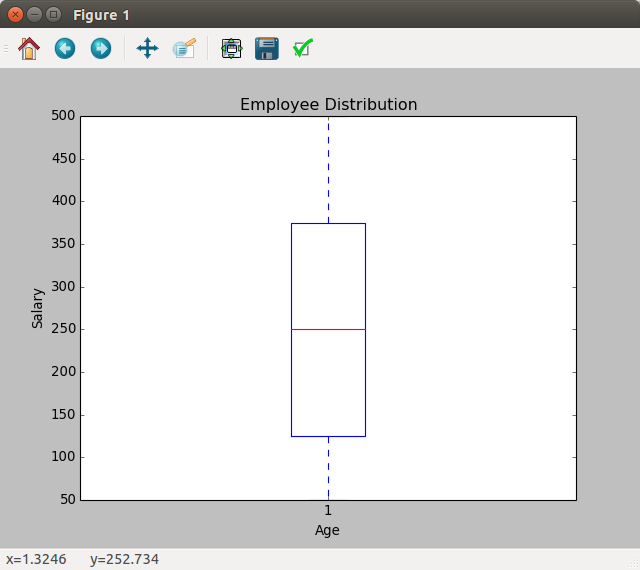
To visualize the data using box plot in python.
Call box plot method boxplot() from matplotlib.pyplot.
Pass a variable, what we want to visualize in box plot.
Using box plot, we can examine the outlier values in our data set.
#imported libraries
import matplotlib.pyplot as plt
import pandas as pd
#read CSV file
data=pd.read_csv
(‘/home/soft27/soft27/Sathish/
Pythonf iles/Employee.csv’)
#create the Data frame
df=pd.DataFrame(data)
#calling the box plot method
plt.boxplot(df[‘Salary’])
plt.title(‘Employee Distribution’)
plt.xlabel(‘Age’)
plt.ylabel(‘Salary’)
plt.show()
