Research Breakthrough Possible @S-Logix pro@slogix.in

Office Address

Social List

How to Visualize Data Using Histogram in Python

Histogram Visualization in Python

Condition for Visualizing Data Using Histogram in Python

  • Description:
    A histogram is a graphical representation of the distribution of numerical data. It shows the frequency (or count) of data points within certain ranges, called bins. A histogram provides a way to visualize the distribution of data, making it easier to identify patterns, skewness, and outliers.
Step-by-Step Process
  • Install Required Libraries:
    Ensure you have `matplotlib` and `numpy` (or `pandas` for datasets).
  • Prepare the Data:
    Use a numeric dataset, either generated or imported.
  • Use `plt.hist()`:
    The `hist()` function in `matplotlib` allows you to create histograms.
  • Customize:
    You can adjust bin sizes, labels, and other parameters.
Sample Source Code
  • # Histogram plot

    import pandas as pd

    import matplotlib.pyplot as plt

    data = {
    'Height': [170, 180, 165, 160, 175, 185, 190, 160, 175, 168,
    172, 174, 169, 180, 177, 171, 167, 173, 179, 181]
    }

    df = pd.DataFrame(data)

    plt.hist(df['Height'], bins=6, color='orange', edgecolor='black')

    plt.title('Height Distribution of People')
    plt.xlabel('Height (cm)')
    plt.ylabel('Frequency')

    plt.show()
Screenshots
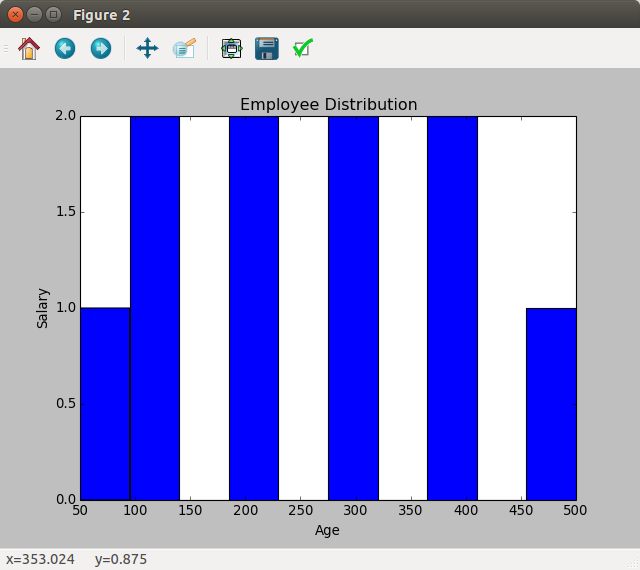
  • Histogram Output