How to Predict Alcohol Content in Wine Using a DNN Model in Keras and Python?
Share
Condition for Predicting Alcohol Content in Wine Using a DNN Model in Keras and Python
Description: This model predicts the alcohol content in wine based on various features of the wine dataset using a neural network regression approach. It leverages multiple hidden layers with ReLU activation and L2 regularization to capture complex patterns. The model is trained using the Adam optimizer and evaluated using metrics like MAE, MSE, RMSE, R², and MAPE.
Step-by-Step Process
Step1: Import necessary libraries like pandas, sklearn, tensorflow seaborn, and matplotlib for data handling, model building,and visualization.
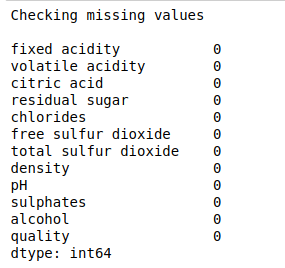
Step2: Load the wine dataset (WineQT.csv) and check for any missing values using isnull().sum().
Step3: Compute the correlation matrix for the dataset and display it to understand relationships between features.
Step4: Plot a heatmap of the correlation matrix using seaborn.heatmap() to visualize feature correlations.
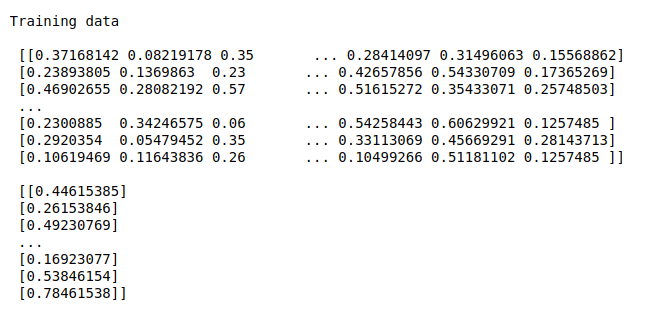
Step5: Use StandardScaler to standardize the feature columns (x) for consistent model performance.
Step6: Separate the features (x) and target variable (y, alcohol content) from the dataset.
Step7: YSplit the dataset into training and testing sets (80% train, 20% test) using train_test_split().
Step8: Create a regression neural network model with 3 hidden layers, ReLU activations, dropout layers, and L2 regularization.
Step9: Compile the model with Adam optimizer, mean squared error loss,and MAE metric, and train for 100 epochs.
Step10: Make predictions, then calculate and print evaluation metrics: MAE, MSE, RMSE, R², and MAPE to assess model performance.
Sample Code
#Import Necessary Libraries
import pandas as pd
from sklearn.preprocessing import StandardScaler
import seaborn as sns
import matplotlib.pyplot as plt
from sklearn.model_selection import train_test_split
from tensorflow.keras.layers import Dense,Input,Dropout
from tensorflow.keras.models import Model
from tensorflow.keras.regularizers import l2
import warnings
warnings.filterwarnings("ignore")
from sklearn.metrics import mean_absolute_error, mean_squared_error, r2_score
import numpy as np
df = pd.read_csv("/home/soft12/Downloads/sample_dataset/Website/Dataset/WineQT.csv")
#check null values in dataset
df.isnull().sum()
#find correlation between samples
correlation_matrix = df.corr()
# Display the correlation matrix
print(correlation_matrix)
# Plot the heatmap
plt.figure(figsize=(10, 8))
sns.heatmap(correlation_matrix, annot=True, cmap='coolwarm', fmt='.2f', linewidths=0.5)
plt.title('Correlation Heatmap')
plt.show()
scaler = StandardScaler()
x = df.drop('alcohol',axis=1)
x = scaler.fit_transform(x)
y = df['alcohol']
#Split the train_test_data
X_train,X_test,y_train,y_test = train_test_split(x,y,test_size=.2,random_state=42)
def ANN_regression_model(input_shape):
# Input layer
inputs = Input(shape=(input_shape,))
# Hidden layers
layer1 = Dense(128, activation='relu', kernel_regularizer=l2(0.01))(inputs)
Dropout1 = Dropout(0.2)(layer1)
layer2 = Dense(64, activation='relu')(Dropout1)
Dropout2 = Dropout(0.2)(layer2)
layer3 = Dense(32, activation='relu')(Dropout2)
output_layer = Dense(1)(layer3)
# Output layer (no activation for regression, it defaults to linear)
output_layer = Dense(1)(Dropout2)
# Build the model
ann_model = Model(inputs=inputs, outputs=output_layer)
# Compile the model with Adam optimizer and mean squared error loss function
ann_model.compile(optimizer='adam', loss='mean_squared_error', metrics=['mae']) # mae (mean absolute error) as a metric
return ann_model
# Assuming X_train and y_train are ready for the regression task
model = ANN_regression_model(X_train.shape[1])
# Fit the model
model.fit(X_train, y_train, batch_size=2, epochs=100, validation_data=(X_test, y_test))
# Make predictions (regression output)
y_pred = model.predict(X_test)
y_test = np.array(y_test)
y_pred = np.array(y_pred)
# Calculate MAE, MSE, RMSE, R2, and MAPE
mae = mean_absolute_error(y_test, y_pred)
mse = mean_squared_error(y_test, y_pred)
rmse = np.sqrt(mse)
r2 = r2_score(y_test, y_pred)
# Calculate MAPE (optional)
mape = np.mean(np.abs((y_test - y_pred) / y_test)) * 100
# Print the metrics
print("___Performance_Metrics___\n")
print("Mean Absolute Error (MAE): ", mae)
print("Mean Squared Error (MSE): ", mse)
print("Root Mean Squared Error (RMSE): ", rmse)
print("R-squared (R²): ", r2)
print("Mean Absolute Percentage Error (MAPE):", mape)