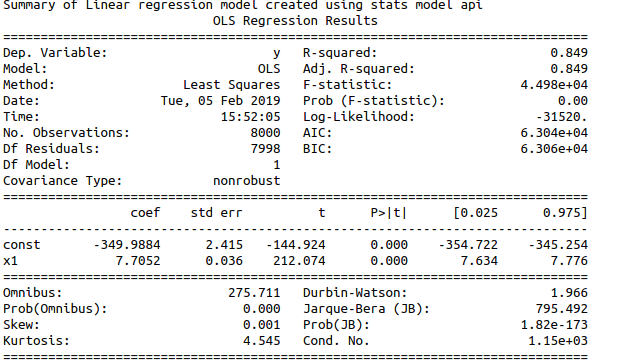
To create a simple linear regression model for the given data set and analyse the summary and goodness of the model
Load the data set
Find and resolve the Missing values
Find and resolve the Outliers
Split the data set for training and testing with ratio 80:20 so that training and testing data has 80% and 20% of the original data set respectively
Build the model
Fit the model using the training data
Test the model using the test data
Take the summary and analyse it
Building a simple linear regression model :Simple linear regression model can be created in python in two different methods.They are
Using sklearn library
Using statsmodel api
Using sklearn library : Required libraries :from sklearn.model_selection import train_test_split
from sklearn.linear_model import LinearRegression
from sklearn import metrics
Functions used :To split the data - x_train, x_test, y_train, y_test = train_test_split(x, y, test_size=0.20, random_state=42)
To build the model - reg=LinearRegression()
To train the model - reg.fit(x_train_data,y_train_data)
To test the model - reg.predict(x_test_data)
To find the R -Squared value - reg.score(x_test,y_test)
To find the R-Squared value using metrics library - metrics.r2_score(y_test,y_pred)
Using statsmodel api : Required libraries :import statsmodels.api as sm
Functions used :To Train the model - model = sm.OLS(y_train,x_train)
To fit the model - results = model.fit()
To test the model - results.predict(x_test)
To take the summary -results.summary()
#import necessary libraries
import pandas as pd
import numpy as np
import matplotlib.pyplot as plt
from sklearn.model_selection import train_test_split
from sklearn.linear_model import LinearRegression
from sklearn import metrics
import statsmodels.api as sm
import warnings
warnings.filterwarnings(“ignore”)
#Read the file
data=pd.read_csv(‘/home/soft23/soft23/Akshaya/weight-height.csv’)
#Function to find and resolve the missing values
def res_mv(df):
for i in df.describe().columns:
if df[i].isnull().sum()!=0:
df[i].fillna(df[i].median(),inplace=True)
for i in df.describe(include=pd.core.series.Series).columns:
if df[i].isnull().sum()!=0:
df[i].fillna(method=”bfill”,inplace=True)
#Function to detect and resolve the outliers
def outlier_detect(df):
for i in df.describe().columns:
Q1=df.describe().at[‘25%’,i]
Q3=df.describe().at[‘75%’,i]
IQR=Q3 – Q1
LTV=Q1 – 1.5 * IQR
UTV=Q3 + 1.5 * IQR
x=np.array(df[i])
p=[]
for j in x:
if j < LTV or j>UTV:
p.append(df[i].median())
else:
p.append(j)
df[i]=p
print(“Outliers resolved”)
return df
#To Resolve the Missing values
res_mv(data)
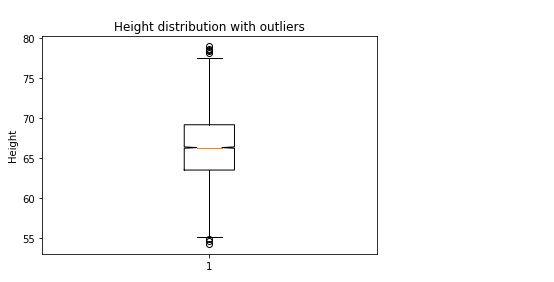
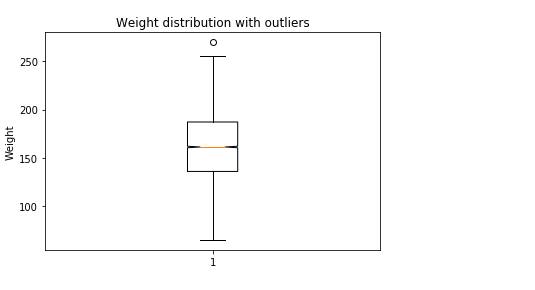
#To identify the outliers using boxplot
plt.boxplot(data[‘Height’],notch=True)
plt.title(‘Height distribution with outliers’)
plt.ylabel(‘Height’)
plt.show()
plt.boxplot(data[‘Weight’],notch=True)
plt.title(‘Weight distribution with outliers’)
plt.ylabel(‘Weight’)
plt.show()
#To Resolve the outliers
data=outlier_detect(data)
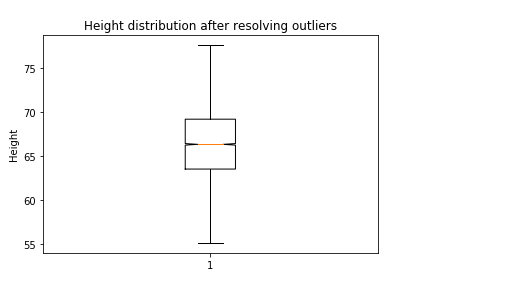
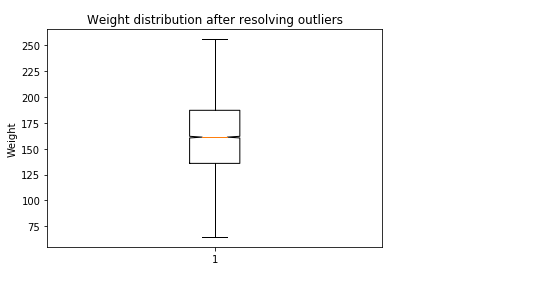
#boxplot after resolving the outliers
plt.boxplot(data[‘Height’],notch=True)
plt.title(‘Height distribution after resolving outliers’)
plt.ylabel(‘Height’)
plt.show()
plt.boxplot(data[‘Weight’],notch=True)
plt.title(‘Weight distribution after resolving outliers’)
plt.ylabel(‘Weight’)
plt.show()
#convert the dataset so that it has 1 dimension array with 0 features
x=data[[‘Height’]].values.reshape(-1,1)
y=data[‘Weight’].values.reshape(-1,1)
#data dplitting for training and testing the model
x_train, x_test, y_train, y_test = train_test_split(x, y, test_size=0.20, random_state=42)
#To Build the model using SkLearn
reg = LinearRegression()
reg.fit(x_train,y_train)
print(“Regression intercept is “,reg.intercept_)
print(“Regression coefficient is “,reg.coef_)
print(“The determination of coefficient R^2 is “,reg.score(x_test,y_test))
y_pred=reg.predict(x_test)
print(“The R^2 value for actual and predicted value is “,metrics.r2_score(y_test,y_pred))
print(reg.score(x_train,y_train))
#To Build the model using statsmodel pi
#Xtrain should be given to add constant() to see the coefficients
x_train = sm.add_constant(x_train)
#using the statsmodel
#build regression model
model = sm.OLS(y_train,x_train)
results = model.fit()
#Take the summary of the model
print(“Summary of Linear regression model created using stats model api”)
print(results.summary())
#predict the y value using x test
x_test=sm.add_constant(x_test)
pred = results.predict(x_test)
