To detect fraud transaction using logistic regression algorithm using python.
Read the data set.
Do data pre-processing.
Split the data into train and test.
Build the logistic model.
Train the classifier.
Test the classifier with test data.
Measure precision,recall and f1-score and accuracy of the model.
#import libraries
import warnings
warnings.filterwarnings(“ignore”)
import pandas as pd
import matplotlib.pyplot as plt
import seaborn as sns
from sklearn.model_selection import train_test_split
from sklearn.linear_model import LogisticRegression
from sklearn import metrics
from sklearn.metrics import classification_report
#read the data set
data = pd.read_csv(‘/home/soft23/soft23/Sathish/practice/creditcard.csv’)
#taking sample from population if need
#data = data.sample(30000)
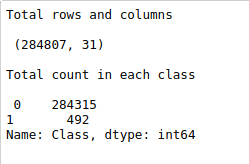
#no of rows and columns
print(“Total rows and columns\n\n”,data.shape,”\n”)
#Dependent and independent variable
X = data.iloc[:, 1:30].columns
y = data[‘Class’]
X = data[X]
#total count in each class
count = data[‘Class’].value_counts()
print(“Total count in each class\n\n”,count)
print(“\n”)
#splitting the data
X_train, X_test, y_train, y_test = train_test_split(X, y, test_size=0.2, random_state=42)
#Build the model
clf = LogisticRegression()
# Train the classifier
clf.fit(X_train, y_train)
#test the model
y_pred = clf.predict(X_test)
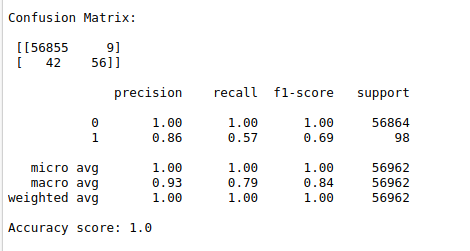
#classification report
cr = (classification_report(y_test, y_pred))
#confusion matrix
cm = (metrics.confusion_matrix(y_test, y_pred))
print(“Confusion Matrix:\n\n”,cm,”\n”)
#classification report
print(classification_report(y_test, y_pred))
#Accuracy score
a= (metrics.accuracy_score(y_test, y_pred))
print(“Accuracy score:”,round(a,1))
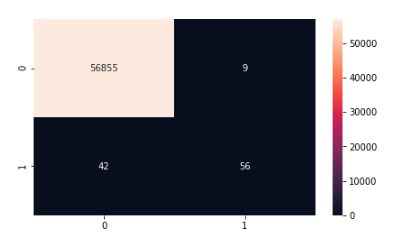
#heat map for confusion matrix
fig, ax = plt.subplots(figsize=(7,4))
sns.heatmap(cm, annot=True, fmt=’d’)
plt.show()
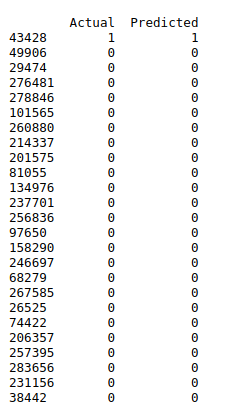
#print the actual and predicted labels
df1 = pd.DataFrame({‘Actual’:y_test, ‘Predicted’: y_pred})
print(df1.head(25))
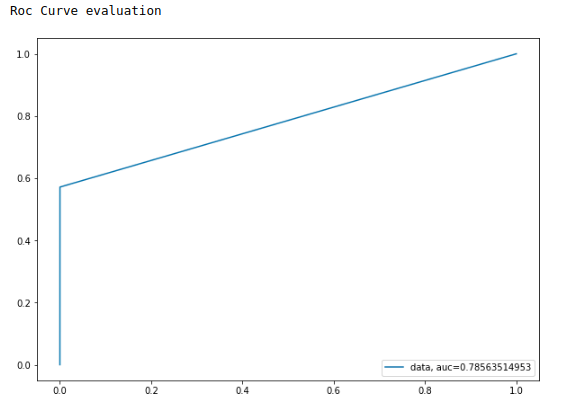
#ROC curve evaluation
print(“Roc Curve evaluation”)
fpr, tpr, _ = metrics.roc_curve(y_test, y_pred)
auc = metrics.roc_auc_score(y_test, y_pred)
plt.plot(fpr,tpr,label=”data, auc=”+str(auc))
plt.legend(loc=4)
plt.show()
