To implement random forest classifier algorithm using python.
Its a supervised machine learning algorithm.
Random forest builds multiple decision trees and merges them together to get a more accurate and stable prediction.
It can be used for both classification and regression problems.
Read the data set.
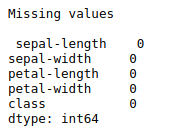
Check missing values
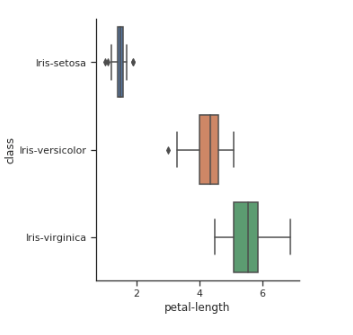
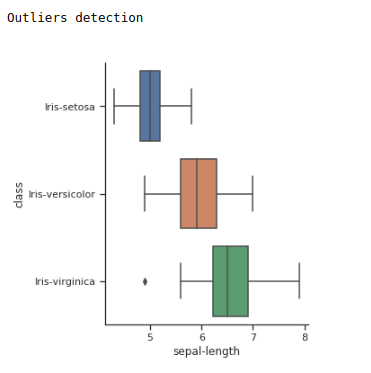
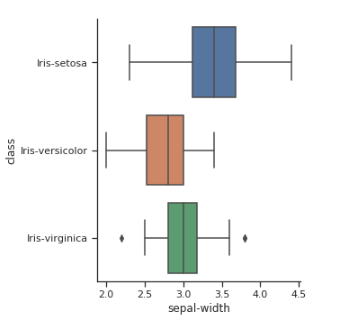
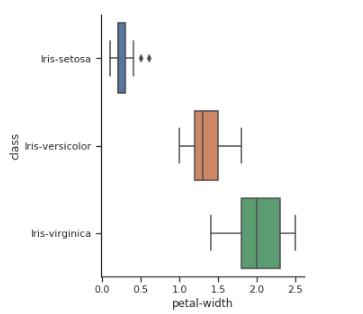
Check outliers for each category.
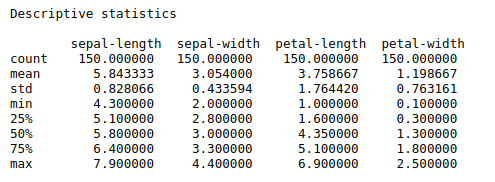
Calculate descriptive statistics.
Split the data into train and test.
Train random forest classifier.
Fit the model.
Print the results.
#import libraries
import numpy as np
import pandas as pd
from sklearn.ensemble import RandomForestClassifier
from scipy.stats import mannwhitneyu,wilcoxon
from sklearn.model_selection import train_test_split
from sklearn.feature_selection import SelectFromModel
from sklearn import metrics
from sklearn.metrics import classification_report
import matplotlib.pyplot as plt
from mpl_toolkits.mplot3d import axes3d
import seaborn as sns
sns.set(style=”ticks”,color_codes=True)
#load data set URL
url = “https://archive.ics.uci.edu/ml/machine-learning-databases/iris/iris.data”
names = [‘sepal-length’, ‘sepal-width’, ‘petal-length’, ‘petal-width’, ‘class’]
data = pd.read_csv(url, names=names)
df = pd.DataFrame(data)
#checking missing values
print(“Missing values\n\n”,df.isnull().sum())
print(“\n”)
#Descriptive statistics
print(“Descriptive statistics\n\n”,df.describe(),”\n”)
X = df.drop(‘class’,1)
y = df[‘class’]
#checking outliers
print(“Outliers detection\n”)
sns.catplot(x=”sepal-length”, y=”class”, kind=”box”, data=df);
plt.show()
sns.catplot(x=”sepal-width”, y=”class”, kind=”box”, data=df);
plt.show()
sns.catplot(x=”petal-length”, y=”class”, kind=”box”, data=df);
plt.show()
sns.catplot(x=”petal-width”, y=”class”, kind=”box”, data=df);
plt.show()
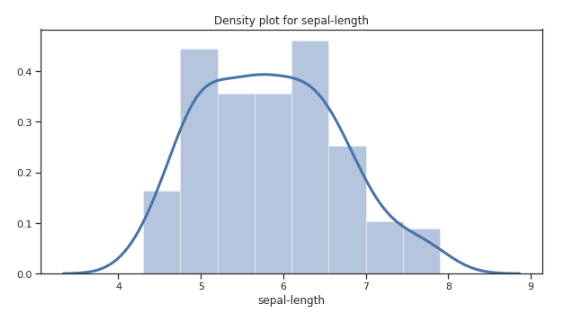
#Density plot
plt.figure(figsize=(10,5))
sns.distplot(df[‘sepal-length’], hist = True, kde = True,kde_kws = {‘linewidth’: 3})
plt.title(“Density plot for sepal-length”)
plt.show()
print(“\n”)
plt.figure(figsize=(10,5))
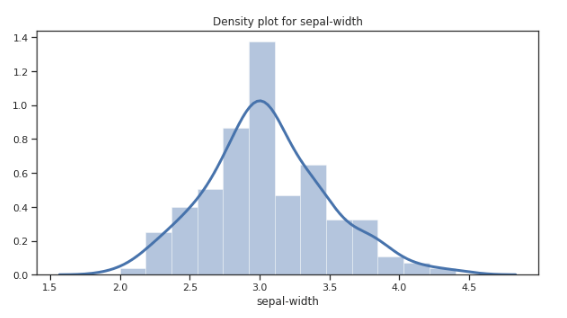
sns.distplot(df[‘sepal-width’], hist = True, kde = True,kde_kws = {‘linewidth’: 3})
plt.title(“Density plot for sepal-width”)
plt.show()
plt.figure(figsize=(10,5))
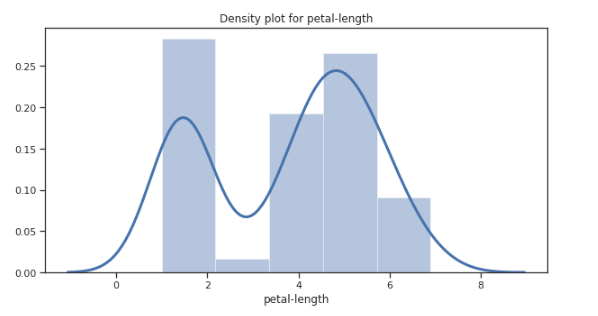
sns.distplot(df[‘petal-length’], hist = True, kde = True,kde_kws = {‘linewidth’: 3})
plt.title(“Density plot for petal-length”)
plt.show()
plt.figure(figsize=(10,5))
sns.distplot(df[‘petal-width’], hist = True, kde = True,kde_kws = {‘linewidth’: 3})
plt.title(“Density plot for petal-width”)
plt.show()
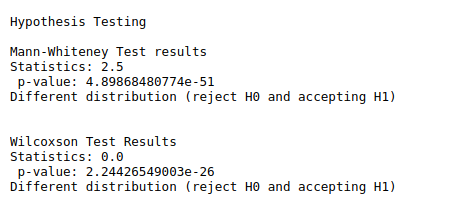
#Hypothesis
#Non parametric test(mann Whiteney test)
print(“\n”)
print(“Hypothesis Testing\n”)
print(“Mann-Whiteney Test results”)
data1 = df[‘sepal-length’]
data2 = df[‘sepal-width’]
stat, p = mannwhitneyu(data1, data2)
print(“Statistics:”,stat,”\n”,”p-value:”,p)
alpha = 0.05
if p > alpha:
print(‘Same distribution (fail to reject H0)’)
else:
print(‘Different distribution (reject H0 and accepting H1)’)
#Wilcoxon test
print(“\n”)
print(“Wilcoxson Test Results”)
data1 = df[‘petal-length’]
data2 = df[‘petal-width’]
stat1, p1 = wilcoxon(data1, data2)
print(“Statistics:”,stat1,”\n”,”p-value:”,p1)
# interpret p-value
alpha = 0.05
if p1 > alpha:
print(‘Same distribution (fail to reject H0)’)
else:
print(‘Different distribution (reject H0 and accepting H1)’)
print(“\n”)
#split the data train and test
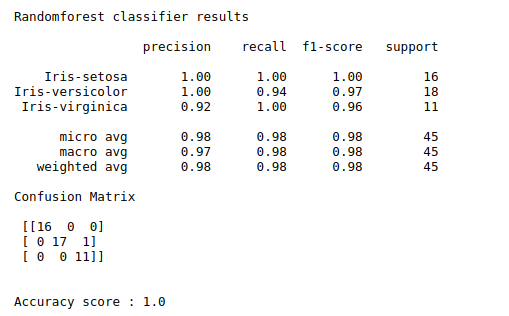
print(“Randomforest classifier results\n”)
X_train, X_test, y_train, y_test = train_test_split(X, y, test_size=0.3, random_state=0)
clf = RandomForestClassifier(n_estimators=10000, random_state=0, n_jobs=-1)
# Train the classifier
clf.fit(X_train, y_train)
y_pred = clf.predict(X_test)
print(classification_report(y_test, y_pred))
print(“Confusion Matrix\n\n”,metrics.confusion_matrix(y_test, y_pred))
a=metrics.accuracy_score(y_test, y_pred)
print(“\n”)
print(“Accuracy score :”,round(a,1))
