To implement SVM for classification problem using python.
#import libraries
import warnings
warnings.filterwarnings(“ignore”)
import pandas as pd
import numpy as np
from sklearn.svm import SVC
import matplotlib.pyplot as plt
import plotly.plotly as py
import plotly.graph_objs as go
import scipy.stats
from scipy.stats import ttest_ind,mannwhitneyu,wilcoxon
import seaborn as sns
sns.set(style=”ticks”,color_codes=True)
from sklearn.model_selection import train_test_split
from sklearn import metrics
from sklearn.metrics import classification_report,confusion_matrix
#load data set URL
url = “https://archive.ics.uci.edu/ml/machine-learning-databases/iris/iris.data”
names = [‘sepal-length’, ‘sepal-width’, ‘petal-length’, ‘petal-width’, ‘class’]
data = pd.read_csv(url, names=names)
df = pd.DataFrame(data)
X = df.drop(‘class’,1)
print(“X variable\n\n”,X.head())
y = df[‘class’]
print(“y variable\n\n”,y.head())
print(“\n”)
#Pie chart
print(“Data visualization\n”)
def piechart(data):
df1 = data.sample(20)
explode=(0.2,0.1,0.1,0.3,0.2,0.2,0.2,0.1,0.3,0.2,0.2,0.1,0.1,0.3,0.2,0.2,0.2,0.1,0.3,0.2)
print(“Pie chart comparison\n”)
plt.pie(df1[‘sepal-length’], labels = df1[‘class’],explode = explode, startangle=45, autopct=’%.1f%%’)
plt.show()
print(“\n”)
piechart(data)
#Count plot
print(“Count plots”)
sns.countplot(x=df[‘sepal-length’],data=df, palette=’hls’)
plt.title(“sepal-length count”)
plt.show()
print(“\n”)
sns.countplot(x=df[‘sepal-width’],data=df, palette=’hls’)
plt.title(“sepal-width count”)
plt.show()
print(“\n”)
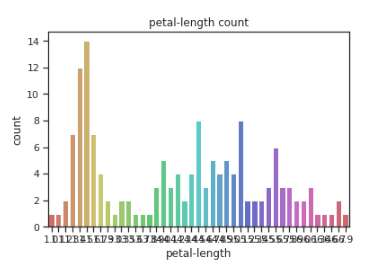
sns.countplot(x=df[‘petal-length’],data=df, palette=’hls’)
plt.title(“petal-length count”)
plt.show()
print(“\n”)
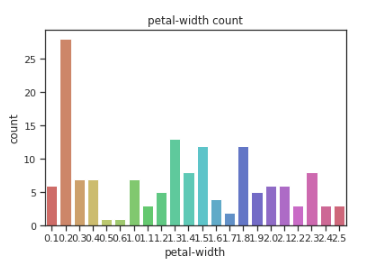
sns.countplot(x=df[‘petal-width’],data=df, palette=’hls’)
plt.title(“petal-width count”)
plt.show()
print(“\n”)
#Hypothesis
#Non parametric test(mann Whiteney test)
print(“\n”)
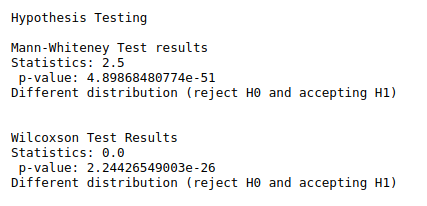
print(“Hypothesis Testing\n”)
print(“Mann-Whiteney Test results”)
data1 = df[‘sepal-length’]
data2 = df[‘sepal-width’]
stat, p = mannwhitneyu(data1, data2)
print(“Statistics:”,stat,”\n”,”p-value:”,p)
alpha = 0.05
if p > alpha:
print(‘Same distribution (fail to reject H0)’)
else:
print(‘Different distribution (reject H0 and accepting H1)’)
#Wilcoxon test
print(“\n”)
print(“Wilcoxson Test Results”)
data1 = df[‘petal-length’]
data2 = df[‘petal-width’]
stat1, p1 = wilcoxon(data1, data2)
print(“Statistics:”,stat1,”\n”,”p-value:”,p1)
# interpret the results
alpha = 0.05
if p1 > alpha:
print(‘Same distribution (fail to reject H0)’)
else:
print(‘Different distribution (reject H0 and accepting H1)’)
print(“\n”)
#Split the data train and test
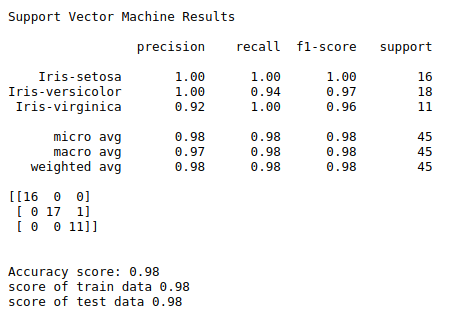
print(“Support Vector Machine Results\n”)
X_train, X_test, y_train, y_test = train_test_split(X, y, test_size=0.3, random_state=0)
#Support Vector machine classifier
svclassifier = SVC(kernel=’linear’)
#fit the model
svclassifier.fit(X_train, y_train)
#predict the test data
y_pred = svclassifier.predict(X_test)
#evaluating the algorithm
print(classification_report(y_test, y_pred))
print(confusion_matrix(y_test, y_pred))
print(“\n”)
a = metrics.accuracy_score(y_test, y_pred)
print(“Accuracy score:”,round(a,2))
train = svclassifier.score(X_train, y_train)
print(“score of train data”,round(train,2))
test = svclassifier.score(X_test, y_test)
print(“score of test data”,round(test,2))


