Research breakthrough possible @S-Logix pro@slogix.in

Office Address

Social List

How to Make Predictions in Multiple Linear Regression Using the Statsmodels Library in Python?

Make Prediction in Multiple Linear Regression using Statsmodel Library

Conditions for Making Predictions with Multiple Linear Regression in Statsmodels

  • Description:
    Multiple Linear Regression (MLR) is a statistical method used to model the relationship between two or more features and a response by fitting a linear equation to the observed data. In this method, each feature contributes to the prediction of the outcome. The statsmodels library in Python provides tools for estimating and interpreting linear models, making it easy to perform statistical analyses, such as multiple linear regression
Why Should We Use Multiple Linear Regression?
  • Predictive Modeling: MLR is helpful for predicting a continuous dependent variable based on multiple independent variables
  • Interpretability: The coefficients in the regression model show how each feature affects the target variable.
  • Flexibility: It can handle complex relationships with more than one predictor variable.
  • Correlation Insights: Helps in understanding how predictor variables are related to each other and the target variable.
Step-by-Step Process
  • Load Data: Import the dataset and examine the structure.
  • Preprocessing: Clean the data by handling missing values, outliers, and normalizing features if necessary.
  • Exploratory Data Analysis (EDA): Visualize the relationships between variables using plots, heatmaps, and correlation matrices.
  • Feature Selection: Identify which features are most important for the model.
  • Train-Test Split: Divide the dataset into a training set and a testing set to evaluate model performance.
  • Model Training: Use statsmodels to build the regression model.
  • Model Evaluation: Evaluate the model using metrics like R², RMSE, etc.
  • Prediction: Use the trained model to make predictions on unseen data.
Sample Code
  • import pandas as pd
    import numpy as np
    import seaborn as sns
    import matplotlib.pyplot as plt
    import statsmodels.api as sm
    from sklearn.model_selection import train_test_split
    from sklearn.metrics import mean_squared_error, r2_score
    from sklearn.preprocessing import LabelEncoder
    # Load the dataset
    df = pd.read_csv('Student_Marks.csv')
    # Check the first few rows of the dataset to understand its structure
    print(df.head())
    label_encoder = LabelEncoder()
    for column in df.select_dtypes(include='object').columns:
      df[column] = label_encoder.fit_transform(df[column])
    # Data Exploration
    # Check for missing values
    print("\nMissing values:\n", df.isnull().sum())
    # Basic statistical summary
    print("\nStatistical Summary:\n", df.describe())
    # Heatmap of correlations to visualize the relationship between features
    plt.figure(figsize=(10, 8))
    sns.heatmap(df.corr(), annot=True, cmap='coolwarm', linewidths=0.5)
    plt.title('Correlation Heatmap')
    plt.show()
    # Assuming the last column is the target variable, and the rest are features
    X = df.drop('Marks', axis=1) # Replace 'TargetColumn' with the actual target
    column name in the CSV
    y = df['Marks'] # Replace 'TargetColumn' with the actual target column name
    # Split the dataset into training and testing sets (80-20 split)
    X_train, X_test, y_train, y_test = train_test_split(X, y, test_size=0.2,
    random_state=42)
    # Add a constant to the features for the intercept in the model
    X_train = sm.add_constant(X_train)
    X_test = sm.add_constant(X_test)
    # Build the regression model using statsmodels
    model = sm.OLS(y_train, X_train).fit()
    # Display the summary of the regression
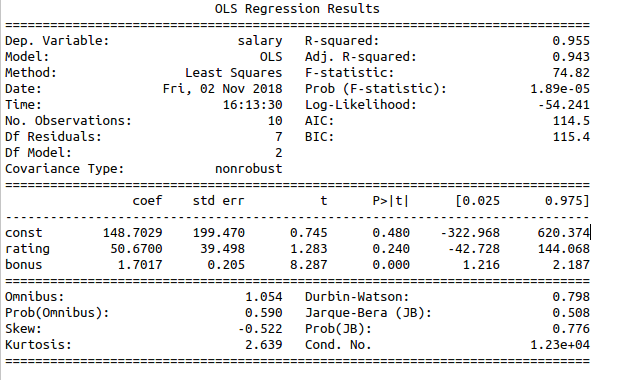
    print("\nRegression Model Summary:\n", model.summary())
    # Predictions using the test set
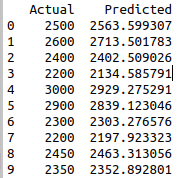
    y_pred = model.predict(X_test)
    # Plotting: Predicted vs Actual
    plt.figure(figsize=(8, 6))
    plt.scatter(y_test, y_pred)
    plt.plot([y_test.min(), y_test.max()], [y_test.min(), y_test.max()], '--r', lw=2)
    plt.xlabel('Actual')
    plt.ylabel('Predicted')
    plt.title('Predicted vs Actual')
    plt.show()
    # Residuals plot
    residuals = y_test - y_pred
    plt.figure(figsize=(8, 6))
    sns.histplot(residuals, kde=True)
    plt.title('Residuals Distribution')
    plt.xlabel('Residuals')
    plt.ylabel('Frequency')
    plt.show()
    # Model Evaluation: Metrics
    # R-squared
    r2 = r2_score(y_test, y_pred)
    print(f"R-squared: {r2}")
    # Mean Squared Error (MSE)
    mse = mean_squared_error(y_test, y_pred)
    print(f"Mean Squared Error: {mse}")
    # Root Mean Squared Error (RMSE)
    rmse = np.sqrt(mse)
    print(f"Root Mean Squared Error: {rmse}")
    # Mean Absolute Error (MAE)
    mae = np.mean(np.abs(residuals))
    print(f"Mean Absolute Error: {mae}")
    # Visualizing the distribution of predicted values
    plt.figure(figsize=(8, 6))
    sns.histplot(y_pred, kde=True)
    plt.title('Predicted Values Distribution')
    plt.xlabel('Predicted')
    plt.ylabel('Frequency')
    plt.show()
Screenshots
  • Multiple Linear Regression Statsmodels