List of Topics:
Research Breakthrough Possible @S-Logix pro@slogix.in

Office Address

Social List

How to Perform Predictions in Simple Linear Regression with Python

Linear Regression Prediction

Condition for Simple Linear Regression Prediction

  • Description:
    Simple Linear Regression helps model the relationship between an independent and a dependent variable. The goal is to find the best-fitting line (linear equation) to predict the dependent variable.

    The process includes data collection, preprocessing, model training, prediction, and evaluation. Key performance metrics include R-squared (R²) and Mean Squared Error (MSE).
Step-by-Step Process
  • Data Collection:
    Collect data with pairs of independent (x) and dependent (y) variables.
  • Data Preprocessing:
    Handle missing values, outliers, and scale features if necessary.
  • Splitting the Data:
    Split the data into training and testing sets (e.g., 80% for training and 20% for testing).
  • Model Building:
    Train a linear regression model using the training data.
  • Model Evaluation:
    Use R² and MSE to evaluate the model’s performance on test data.
  • Model Interpretation:
    Interpret the slope (m) and intercept (b) to understand the relationship between x and y.
  • Making Predictions:
    Predict new values for unseen data.
  • Model Improvement (Optional):
    Consider multiple linear regression or polynomial features if the data is complex.
Sample Source Code
  • # Salary prediction using Linear Regression in Machine Learning

    import pandas as pd
    from sklearn.preprocessing import LabelEncoder, StandardScaler
    from sklearn.model_selection import train_test_split
    from sklearn.linear_model import LinearRegression
    from sklearn.metrics import r2_score, mean_squared_error

    # Load the dataset
    data = pd.read_csv("Salary Data.csv")
    df = pd.DataFrame(data)

    # Rename columns
    df = df.rename(columns={'Education Level':'Education_Level','Job Title':'Job_Title', 'Years of Experience':'Experience'})

    # Drop low correlation columns
    df = df.drop(['Job_Title', 'Gender'], axis=1)

    # Drop rows with NaN values
    df = df.dropna(axis=0)

    # Encode categorical data
    l_encoder = LabelEncoder()
    df['Education_Level'] = l_encoder.fit_transform(df['Education_Level'])

    # Check the correlation
    correlation_matrix = df.corr()
    plt.figure(figsize=(10, 8))
    sns.heatmap(correlation_matrix, annot=True, fmt=".2f", cmap='coolwarm', square=True)
    plt.title('Salary Prediction')
    plt.show()

    # Define X and y variables
    X = df.drop(['Salary'], axis=1)
    y = df['Salary']

    # Scale the features
    s_scalar = StandardScaler()
    X = s_scalar.fit_transform(X)

    # Split the dataset into training and testing sets
    X_train, X_test, y_train, y_test = train_test_split(X, y, test_size=0.1)

    # Train the model
    model = LinearRegression()
    model.fit(X_train, y_train)

    # Make predictions
    y_predict = model.predict(X_test)

    # Evaluate the model
    r2_score_val = r2_score(y_test, y_predict)
    print(f"Prediction accuracy: {r2_score_val}")
    mean_square_error = mean_squared_error(y_test, y_predict)
    print(f"Prediction error (MSE): {mean_square_error}")

Screenshots
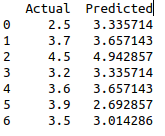
  • Linear Regression Output