To build multiple linear regression model using python.
Import necessary libraries.
Import OLS model from statsmodel.
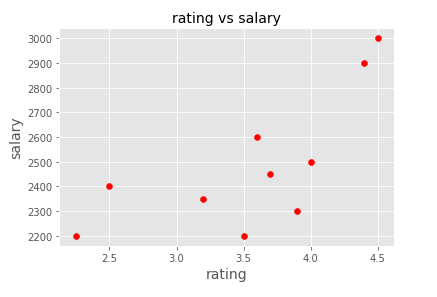
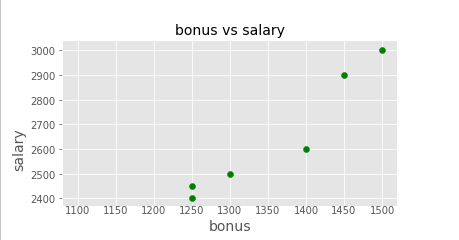
Plot scatter diagram to check linearity.
Assign independent variables(X).
Assign dependent variable(Y).
Build the regression model.
Fit X and Y
#import libraries
import statsmodels.api as sm
import pandas as pd
import matplotlib.pyplot as plt
#read the data set
data=pd.read_csv(‘/home/soft27/soft27
/Sathish/Pythonfiles/Employee.csv’)
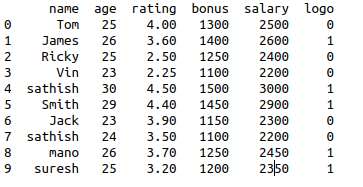
#creating data frame
df=pd.DataFrame(data)
print(df)
#plotting the scatter diagram for independent variable 1
plt.scatter(df[‘rating’], df[‘salary’], color=’red’)
plt.title(‘rating vs salary’, fontsize=14)
plt.xlabel(‘rating’, fontsize=14)
plt.ylabel(‘salary’, fontsize=14)
plt.grid(True)
plt.show()
#plotting the scatter diagram for independent variable 2
plt.scatter(df[‘bonus’], df[‘salary’], color=’green’)
plt.title(‘bonus vs salary’, fontsize=14)
plt.xlabel(‘bonus’, fontsize=14)
plt.ylabel(‘salary’, fontsize=14)
plt.grid(True)
plt.show()
#assigning the independent variable
X = df[[‘rating’,’bonus’]]
#assigning the dependent variable
Y = df[‘salary’]
#Build multiple linear regression
X = sm.add_constant(X)
#fit the variables in to the linear model
model = sm.OLS(Y, X).fit()
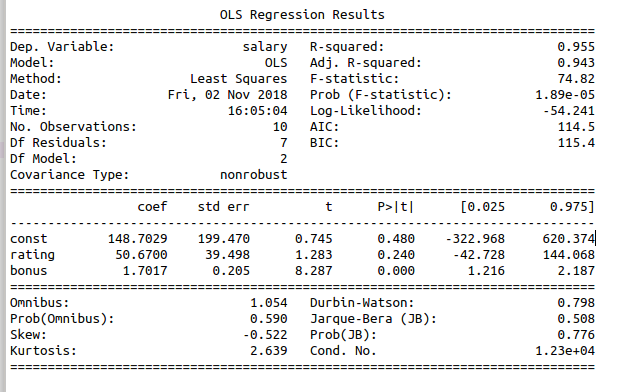
#print the intercept and regression co-efficient
print_model = model.summary()
print(print_model)


