To train a machine learning model for classify products review using Naive Bayes in python.
Amazon product review data set. (Kaggle)
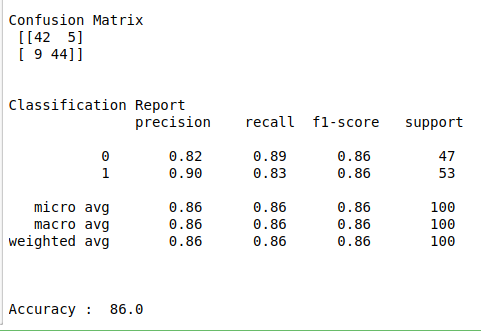
Confusion matrix, classification report and accuracy_score.
Import library.
Load the data set.
Declare independent and dependent variables.
Do pre process for text data.
Split the data into train and test.
Build the model.
Fit the train data into the model.
Evaluate the model using test data.
#import necessary libraries
import pandas as pd
import numpy as np
import re
import warnings
import seaborn as sns
warnings.filterwarnings(“ignore”)
import matplotlib.pyplot as plt
from sklearn.model_selection import train_test_split
from sklearn.naive_bayes import MultinomialNB
from sklearn.feature_extraction.text import TfidfVectorizer
from sklearn.metrics import classification_report, confusion_matrix, accuracy_score
#column header
names = [‘comments’,’type’]
#load data
data = pd.read_table(‘…/amazon_cells_labelled.txt’,sep=”\t”,names = names)
#check missing values
print(“Checking missing values\n\n”)
print(data.isnull().sum())
#make it as a data frame
df = pd.DataFrame(data)
#counts in each class
print(“\n”)
print(“Counts in each class\n”)
print(df[‘type’].value_counts())
#Features
X = df[‘comments’]
y = df[‘type’]
#change text lower cases and removal of white spaces
lower_text = []
for i in range(0,len(X)):
s = str(X[i])
s1 = s.strip()
lower_text.append(s1.lower())
#print(“After converting text to lower case\n\n”,lower_text)
#Remove punctuation
punc_text = []
for i in range(0,len(lower_text)):
s2 = (lower_text[i])
s3 = re.sub(r'[^\w\s2]’,”,s2)
punc_text.append(s3)
#print(“After removed punctuation\n\n”,punc_text)
#Word vectorization
#Initialize the TF-IDF vectorizer
tfidf = TfidfVectorizer(sublinear_tf=True, min_df=5,max_df = 0.7,norm=’l2′, encoding=’latin-1′, ngram_range=(1, 2),
stop_words=’english’)
#transform independent variable using TF-IDF vectorizer
print(“\n”)
X_tfidf = tfidf.fit_transform(punc_text)
print(“After vectorized text data\n\n”,X_tfidf)
#Split the data into train and testing
X_train, X_test, Y_train, Y_test = train_test_split(X_tfidf, y, test_size=0.1, random_state=0)
#Print training data
print(“\n”)
print(“Training data\n\n”,X_train,”\n”,Y_train)
print(“\n\n”)
#Print testing data
print(“Testing data\n\n”,X_test)
print(“\n\n”)
#Build the Naive_bayes model
clf = MultinomialNB()
#Fit train and test into the model
clf.fit(X_train, Y_train)
#Predict the result
y_pred = clf.predict(X_test)
#classification report & confusion matrix
print(“Confusion Matrix\n”,confusion_matrix(Y_test,y_pred))
print(“\n”)
print(“Classification Report\n”,classification_report(Y_test,y_pred))
print(“\n”)
print(“Accuracy : “,accuracy_score(Y_test,y_pred)*100)
