Research breakthrough possible @S-Logix
pro@slogix.in
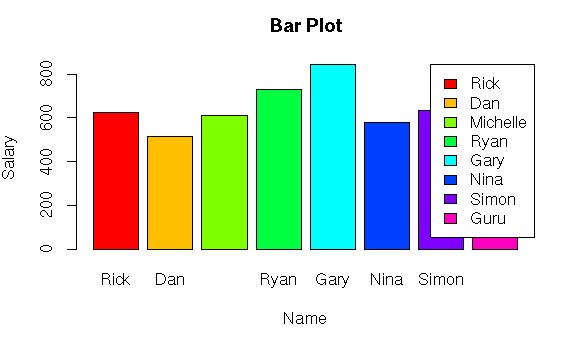
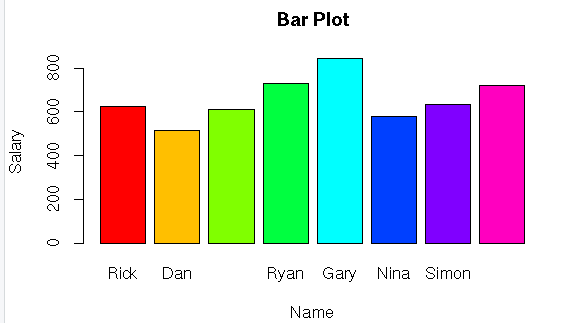
To create a bar chart for the given data using R programming.
Representation data in rectangular bars with the length of the bar proportional to the value of the variable.
R Function : barplot()
#Data Visualization in Bar Chart
#Read File
print(getwd())
setwd(“/home/soft13″)
print(getwd())
data<-read.csv(‘input.csv’)
print(data)
#Bar Chart
barplot(data$salary,names.arg = data$name,main=”Bar Plot”,xlab=”Name”,ylab=”Salary”,col=rainbow(length(data$salary)))
legend(“topright”,legend=data$name,fill=rainbow(length(data$salary)))

