Research Breakthrough Possible @S-Logix
Office Address
- 2nd Floor, #7a, High School Road, Secretariat Colony Ambattur, Chennai-600053 (Landmark: SRM School) Tamil Nadu, India
- pro@slogix.in
- +91-81240 01111
To create a boxplot for the given data using R programming.
Measure how well data is distributed in a data set.
Divides the data set into three quartiles.
Represents the minimum, maximum, median, first quartile and third quartile in the data set.
Useful in comparing the distribution of data across data sets by drawing boxplots for each of them.
R Function : boxplot()
#Data Visualization in Box plot
#Read File
print(getwd())
setwd(“/home/soft13″)
print(getwd())
data<-read.csv(‘input.csv’)
print(data)
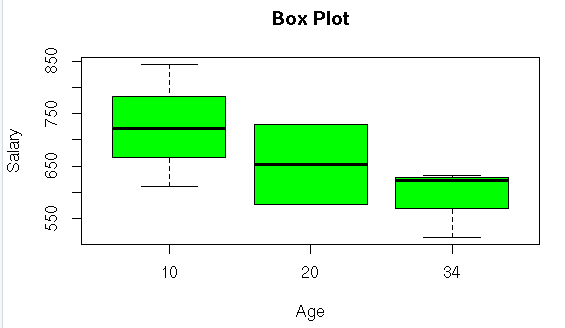
#Box Plot
age<-c(34,34,10,20,10,20,34,10)
boxplot(data$salary~age,main=”Box Plot”,xlab=”Age”,ylab=”Salary”,col=”green”)
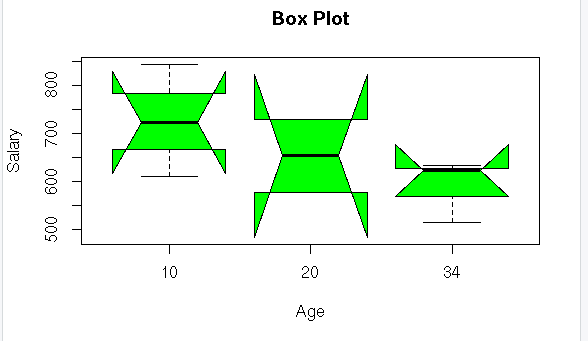
#Adding Notch
boxplot(data$salary~age,main=”Box Plot”,xlab=”Age”,ylab=”Salary”,col=”green”,notch=TRUE)